The airline industry is a vital cog in global commerce, connecting people and places while pushing the boundaries of the digital landscape. Today’s airlines are more than just transportation providers; they’re architects of travel experiences. They leverage the power of online platforms to craft engaging journeys that begin well before passengers board the plane.
This shift has elevated the significance of a robust digital presence. It’s no longer just about marketing and customer service; it’s the foundation of your brand, the battleground for customer loyalty, and the platform where you tell your story. In a fiercely competitive market, a compelling digital strategy can propel your airline to new heights, but a weak one can leave you grounded.
Introducing the Case Studies:
In this case study, we will be looking at five distinct airlines, each with a unique roadmap for navigating the online world. We’ll explore the strategies of Southwest Airlines, the master of social engagement; Qatar Airways, the epitome of luxury travel; Emirates, the global connector; Hawaiian Airlines, the ambassador of paradise; and Caribbean Airlines, the pride of the Antilles. Each serves as a valuable case study in digital strategy.
Focusing on Caribbean Airlines:
Caribbean Airlines, the national carrier of Trinidad and Tobago, stands at a pivotal moment. It has the potential to not only connect the islands and beyond, but also to craft a powerful digital narrative that resonates with both regional pride and global aspirations.
The Objective:
This case study has a dual mission:
- Shine a Light: We’ll delve into each of these airlines’ digital presences, drawing valuable insights.
- Caribbean Airlines: We will be looking to see our own Caribbean Airlines measures up to the industry giants, looking to see how we can improve our own digital strategy.
Data Collection
Our focus was on several key performance indicators. We looked at the traffic mix to the brands websites from Organic Search, Paid Ads, Social Media and Direct Traffic. For social media, we looked at the overall Brands Following, Social Engagement metrics, including likes, comments, shares, and the overall interactions that reflect an airline’s reach and influence on platforms such as Facebook, Twitter, Instagram, TikTok and YouTube.
Data collection was conducted over two specific periods to offer a balanced view of each airline’s online performance. For the website history, we looked at data from Sept to March. The second period was for social media and we looked at March’s performance. This provided a well-rounded perspective on the digital presence of the airlines.
The Overall Digital Performance
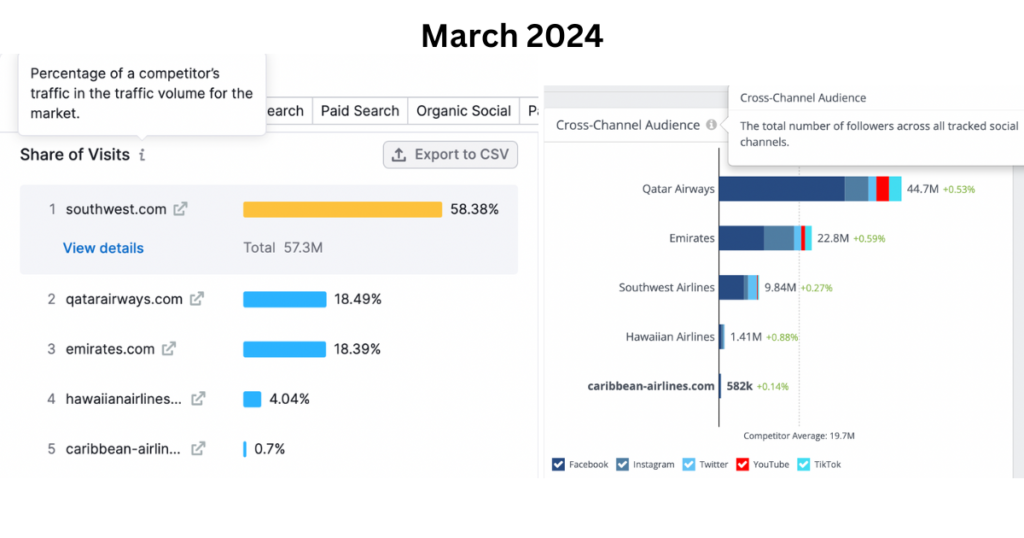
In the digital arena, the true measure of success is reflected in the balance between traffic-driven engagement and a commanding social presence. It’s a digital ballet, where each move from SEO to tweet, from backlink to story, plays a critical role in elevating an airline’s online stature. As we analyze the combined metrics of website traffic and social media performance, we look at the overall leaderboard, with the website traffic ranking on the left and overall follower count of the airlines across all social channels on the right.
Here’s how the five airlines stack up:
- Southwest Airlines
- Reigns supreme with the highest website traffic, robust organic search presence, and a formidable social media engagement, demonstrating a masterclass in integrated digital strategy. They have the most web traffic but even though they don’t have the most followers, you will learn in this study that they have the highest engagement of all the airlines.
- Qatar Airways
- Stands out with its luxurious brand appeal, high social media engagement rates, particularly on paid platforms, and substantial organic traffic, reflecting a premium digital outreach.
- Emirates
- Not far behind, this carrier showcases strong website conversion rates and a significant social media following, leveraging high-quality content to maintain its digital altitude.
- Hawaiian Airlines
- While more niche, it captures targeted traffic with specialized keywords and enjoys a dedicated social media base, making waves within its specific market segment.
- Caribbean Airlines
- Despite its lower ranking, it holds potential for growth. With focused digital enhancements, particularly in content quality and SEO, it could climb the ranks and challenge the digital leaders.
This ranking not only spotlights the leaders in digital strategy but also uncovers the opportunities for Caribbean Airlines to refine its digital wings and take flight toward a more connected and engaged global audience.
Website Performance From Sept 2023 – March 2024

Understanding how customers find us online is crucial. Let’s dive into the data to see which traffic sources drove the most website visits for our airlines in the past six months.
Here is the ranking based on the provided data, with explanations for each airline’s performance:
- Overall Traffic: The total website traffic for the five airlines from September 2023 to March 2024 was 100.8 million visits.
- Traffic Sources: Here’s how website visitors arrived at the airlines’ websites:
- Organic Search: This was the most common traffic source, accounting for a significant portion of visitors in most months. This means people found the airlines’ websites by searching for them on search engines.
- Paid Search: This was the second most common traffic source for most airlines. This means that people saw the airline’s website in ads on other websites.
- Direct Traffic: This means people typed the airline’s website address directly into their web browser, suggesting brand familiarity.
- Other Traffic Sources: This includes referral traffic, social media traffic, email traffic, and display advertising. These sources played a smaller role in driving traffic to the websites.
Southwest Airlines (Rank 1): Dominates traffic with 58.4%. Their strong performance in both direct traffic (67.2%) and organic search (54.1%) suggests a well-established brand and effective SEO strategy.
Qatar Airways & Emirates (Rank 2 & 3 – Similar Traffic): Capture similar traffic shares (18.5% & 18.3%) but rely heavily on paid search (48.4% & 49.9%). This indicates an aggressive online advertising approach.
Hawaiian Airlines (Rank 4): Receives a lower traffic share (4.0%) but shines in organic search (4.4%). This suggests a website optimized for relevant search terms.
Caribbean Airlines (Rank 5): Holds the lowest traffic share (0.7%) with minimal contribution from all traffic sources. This may indicate a need for a broader digital strategy.
This ranking highlights the diversity of strategies employed in the digital space. While Southwest Airlines leads with a potent mix of direct marketing and engaging content, the lower-ranked airlines, such as Caribbean Airlines, must look to their successful counterparts for lessons in digital strategy enhancement.
The Airlines Social Media Performance
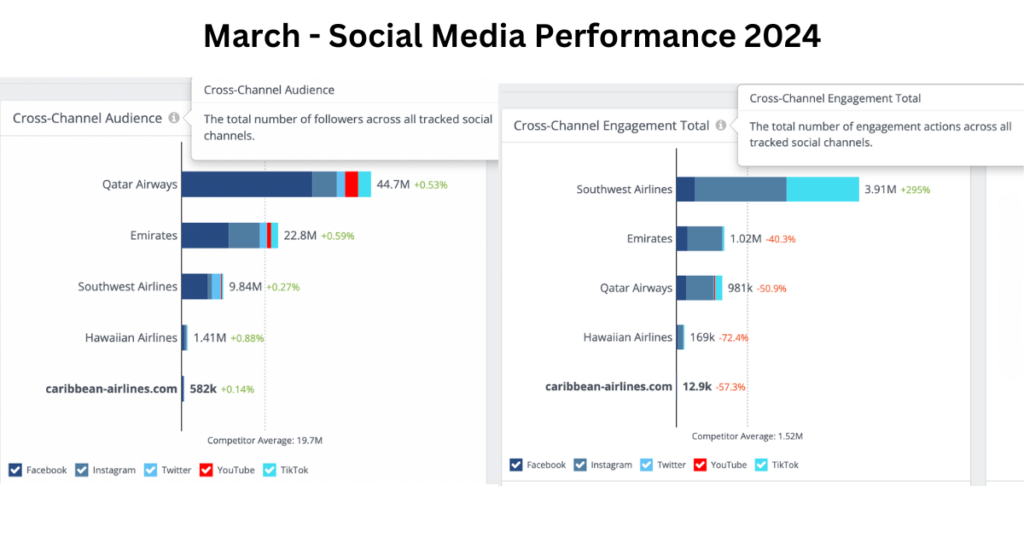
This analysis examines how our airlines performed on social media in March. Let’s start with engagement and follower growth, which are key indicators of brand popularity and audience connection.
1. Southwest Airlines
- They are leading with a cross-channel engagement total of 3.91 million, which is 295% above the competitor average. Their robust follower count of 9.84 million and the significant engagement growth on posts (up to 467%) exemplify their commanding social media strategy. They also dispel the notion that you need a high number of followers in order to get the most engagement.
2. Qatar Airways
- With the highest follower count at 44.7 million, Qatar Airways also witnessed a net increase of 236k followers, demonstrating a 0.53% growth. They maintain a substantial presence, especially on paid social channels, where they see an engagement rate of 97.02%.
3. Emirates
- Emirates, with a follower base of 22.8 million, has a total cross-channel engagement of 1.02 million. Despite engagement rates being 40.3% lower than the average, their strategic email and social campaigns reflect a focused digital engagement plan.
4. Hawaiian Airlines
- Hawaiian Airlines has a smaller, more targeted audience, with 1.41 million followers, but they show promising engagement growth of 0.88%. They achieved a total engagement of 169k across channels, with notable performance on Instagram and TikTok.
5. Caribbean Airlines
- Caribbean Airlines has the smallest follower base at 582k. They show a total cross-channel engagement of 12.9k, which is -57% below the competitor average. Their top Instagram post, however, indicates an opportunity for growth, with 734 engagements, which is 4.9 times their average post engagement.
The #1 Performing Post In March
We analyzed all social media posts from the airlines on all social media platforms for our study of March, and the winner is Southwest Airlines with their video on TikTok featuring First Officer Ben and his daughters first flight.

You can check the video out here —> Southwest Airlines Daddy Daughter Pilot Flight.
Why Did This Perform So Well?
There are several factors contributing to this video’s high performance on TikTok:
- Human Element: The video features a first officer, Ben, introducing his daughter Ellie Rose on her first flight with him as the pilot. This personal, humanizing story resonated emotionally with viewers, adding a layer of relatability and warmth to the airline’s image.
- Relatable Humor: The first officer jokes about his daughter’s behavior, which adds a light-hearted, humorous element. Humor is a powerful tool for engagement on social media.
- Memorable Milestone: The post captures a significant life event — a child’s first flight. This kind of content tends to perform well as it shares a universally relatable and joyous occasion.
- Engagement Metrics:
- Engagement Total: 1.44 million, indicating a massive number of users interacted with the post.
- Likes: 1.42 million, showing that the audience not only watched but actively showed appreciation for the content.
- Comments: 1.97k, suggesting the video sparked conversations and possibly personal stories from viewers.
- Shares: 17.3k, a strong sign of approval as viewers felt compelled to share it with others.
- Engagement Rate by Follower: 467%, an exceptionally high engagement rate, signifying that a significant portion of the airline’s followers interacted with the post.
- Engagement Rate by View: 12.7%, indicating that more than one in ten viewers interacted with the post, a high ratio for social media content.
- Engagement Rate Lift: 2.08 times higher than the average, highlighting how this post outperformed typical content.
- Views: 11.3 million, a clear sign of viral reach.
5. Narrative and Connection: The video tells a story that connects viewers to the lives of the people behind the airline, fostering a sense of community and shared experience.
The combination of authentic, emotionally engaging storytelling, relatable humor, and capturing a special family moment, along with the impressive engagement, all contribute to why this was the top-performing video in the landscape for March.
The Top 4 Performing Posts in March

Southwest Airlines’ mastery of crafting deeply engaging content is showcased in their dominance of the top three spots for social media engagement across the airline industry. Their posts resonate on a human level, creating a narrative that viewers connect with, as evidenced by their number one TikTok post featuring a first officer and his daughter. It’s a perfect blend of personal storytelling, humor, and warmth that’s earned them 1.44 million engagements and a 467% engagement rate by followers, significantly higher than the landscape’s average.
Not to be overlooked, Hawaiian Airlines secured the 4th position with a TikTok post that, while smaller in raw numbers, demonstrates their ability to capture the audience’s attention and hold its own amid the competitive social media space.
What Does Engagement Rate By Follower Mean?
Engagement Rate by Follower is like measuring how many people in a room are talking to you versus just listening. If you have 100 followers, and your post gets an engagement rate of 10%, that means 10 of those followers are actively interacting with what you’ve posted — they might like it, comment on it, or share it with others. It’s a way of seeing not just how many people are in your social media ‘room,’ but how many are actually chatting with you.
It is calculated by taking the total number of interactions a post gets—things like likes, comments, and shares—and dividing it by the total number of followers the account has. Then, you multiply that number by 100 to get a percentage. This tells you the average percentage of your followers who are engaging with a particular post. It’s like figuring out what slice of your audience is not just seeing your content, but actively showing that they like it or want to talk about it.
Activity & Engagement

Here’s the activity and engagement for each airline overall according to the latest social media data:
- Southwest Airlines
- Posts: 63
- Engagement Rate by Follower: 2.19%
- Hawaiian Airlines
- Posts: 89
- Engagement Rate by Follower: 0.54%
- Emirates
- Posts: 58
- Engagement Rate by Follower: 0.32%
- Qatar Airways
- Posts: 208
- Engagement Rate by Follower: 0.065%
- Caribbean Airlines
- Posts: 116
- Engagement Rate by Follower: 0.048%
- Southwest Airlines had fewer posts but the highest engagement rate by follower, suggesting a strong connection with their audience.
- Hawaiian Airlines posted more frequently and came in second for engagement, showing good audience interaction.
- Emirates had a post count similar to Southwest but a lower engagement rate.
- Qatar Airways posted the most but had a very low engagement rate by follower for this period.
- Caribbean Airlines’ post frequency was moderate but had the lowest engagement rate, indicating room for improvement in content engagement. They need to create more compelling content or better-targeted social media strategies
Top Performing Social Media Channel For The Airlines

For Caribbean Airlines, Facebook is their go-to platform, where they’re most frequently sharing updates and connecting with their audience, averaging about 1.63 posts each day. However, when looking at the airline industry as a whole, it’s actually TikTok that’s stealing the spotlight. Despite CAL posting less frequently there, with around 0.07 posts per day, TikTok’s engaging content is making waves for the landscape, drawing in viewers and prompting them to interact about 4.64% of the time they see a post.
Instagram also sees a fair share of activity, with nearly one post per day and an engagement rate of 1.09%. Meanwhile, more traditional platforms like Facebook and YouTube, and the fast-paced Twitter, see more posts but tend to get less engagement, with people interacting with less than 1% of the content.
Top Performing Content Type For The Airlines on Social Media

When it comes to social media content, each post type serves its unique purpose in capturing the audience’s attention. Photos are the Caribbean Airlines go-to type of content, posting around 2.63 per day—simple, but not always effective. Videos pop in with a touch more rarity, about 0.50 per day, offering a deeper dive into the airline’s world.
Looking at the landscape activity, Reels show up around 0.48 times a day and pack the highest punch in terms of engaging viewers, with a 1.51% engagement rate. Carousels are rarely posted at 0.09 per day but when they are, they pack the 2nd highest engagement at 1.31% per follower.
Reels, Carousels and Videos are the top performing types of content amongst the social media audience in the airlines and should be done more if Caribbean Airlines wants to build better engagement on social media. Photos was their preferred type of content to post but they also receive very little engagement amongst the Airline industries social media audience.
The Apps (Play Store Data)
Now, let us look at how each Airline has fared when it comes to app downloads. We will be using the Google Play Stores data as a snapshot to app performance. Globally, Android devices make up 70% of the worlds smartphone marketshare, with iPhones coming in at 28%.
1) Southwest Airlines App
- Downloads: Over 10 million
- User Reviews: 154,000
- Star Rating: 4.7 out of 5 stars
- Note: This high star rating, coupled with the largest number of reviews, suggests strong user satisfaction and a robust feature set that resonates with a large customer base.
2) Emirates
- Downloads: Over 5 million
- User Reviews: 76,100
- Star Rating: 4.6 out of 5 stars
- Note: The app’s high rating and substantial download figures indicate a successful digital tool for enhancing travel experiences for Emirates passengers.
3) Qatar Airways
- Downloads: Over 5 million
- User Reviews: 58,400
- Star Rating: 4.4 out of 5 stars
- Note: With a solid star rating and a significant number of downloads, the Qatar Airways app is a key digital asset for the airline’s customers.
4) Hawaiian Airlines
- Downloads: Over 500,000
- User Reviews: 22,200
- Star Rating: 4.5 out of 5 stars
- Note: While Hawaiian Airlines has fewer downloads, the high star rating indicates that users who do download the app find it very useful and satisfactory.
5) Caribbean Airlines
- Downloads: Over 100,000
- User Reviews: 368
- Star Rating: 3.9 out of 5 stars
- Note: The Caribbean Airlines app has fewer downloads and a lower star rating, showing an area for potential improvement in user experience and app functionality.
Why Southwest Airlines Is the #1 Airline In Our Group
Southwest Airlines is the top performer in our digital analysis. Here’s why they’ve landed in the winner’s circle:
- One-Stop Shop: Southwest seamlessly integrates website, social media, and mobile apps. This smooth user journey fosters brand loyalty and keeps customers engaged.
- Heavy Hitter Traffic: They boast the highest website traffic, showcasing a powerful digital presence and effective online strategies.
- Traffic Powerhouse: Southwest leverages a mix of direct traffic, organic search, paid search, and strong email marketing to attract and retain visitors.
- Social Media Masters: Southwest dominates social media, particularly on TikTok and Instagram, with their knack for viral, engaging content that resonates with audiences.
- Mobile App Champions: Leading in app downloads, they successfully convert their online audience into mobile app users, reflecting high user trust and valuable app features.
- Customer Connection: Humor and customer-centric content fuel their social media strategy, boosting engagement and fostering a positive brand image.
- Marketing Mavericks: Southwest’s marketing initiatives are not just widespread but also innovative, capitalizing on digital trends and consumer behaviors to stay ahead of the curve.
These factors combine to position Southwest as the leader in leveraging digital platforms. They enhance customer experience, brand loyalty, and operational efficiency.
Here Are 5 Things Caribbean Airlines Needs To Work On To Compete
While the data shows Caribbean Airlines ranking lower in digital performance compared to competitors, it also presents valuable opportunities for growth. Here are some key areas for improvement:
- Lower Social Media Engagement: Caribbean Airlines has shown lower engagement rates on social media platforms compared to its peers, indicating that their content may not be resonating as strongly with their audience.
- Fewer App Downloads: With significantly fewer app downloads, it suggests that the airline’s digital tools may not be as widely adopted or valued by customers, pointing towards a potential gap in app functionality or marketing.
- Limited Use of High-Engagement Content: The airline has not fully leveraged high-engagement content types like Reels on Instagram and videos on TikTok, which have been shown to dramatically increase user interaction and brand visibility.
- Suboptimal SEO and Web Traffic: Caribbean Airlines has lower website traffic and engagement, indicating that their SEO strategies may not be fully optimized to attract and retain online visitors. They need to start doing their data research to see Search terms from each destination they fly to and create content that matches search intent. They can then run ads against that content on Google & Social Media.
- Create Better Stories: All destinations they fly to has a number of known and unknown attractions. Creating more stories around the destinations will allow them to create great content for social and then expand it to platforms like YouTube, Podcasts and drive more traffic to their websites.
By focusing on these areas, Caribbean Airlines can significantly improve its digital presence and become a stronger competitor in the online airline landscape.
Here is a Quick SEO Strategy

We can track each of the islands names and measure how many times they have been searched for in any country per month, in this example, we are seeing how many times each island’s name was searched for in the last 28 days in the United States.
Let’s take a closer look at Aruba.
Here is the age demographics of those in the United States, searching for Aruba.

- 35-44 (44%)
- 45-54 (24%)
- 18-24 (11%)
Knowing the ages of the people searching for Aruba will allow you create content that fits each specific age bracket and help you for Ad targeting to ensure the right ages see the intended content.
Now we take a look at the Search Terms they are looking for on Google!

Here are 6 Types of Content To Match The Search Term “Aruba All Inclusive”
- “Ultimate Guide to All-Inclusive Vacations in Aruba”: A comprehensive blog post detailing the best all-inclusive resorts in Aruba, tips for making the most of an all-inclusive stay, and how to book flights with Caribbean Airlines for a seamless vacation experience.
- “Aruba All-Inclusive: Top Picks by Travel Experts”: A video series featuring travel experts or influencers visiting and reviewing different all-inclusive resorts in Aruba, showcasing the amenities and activities available, with a focus on how Caribbean Airlines can enhance the vacation experience.
- “Aruba All-Inclusive Deals and Packages with Caribbean Airlines”: An informative webpage or digital brochure highlighting exclusive all-inclusive vacation packages to Aruba available only through Caribbean Airlines, including special offers, flight + hotel deals, and added benefits for booking through the airline.
- “Why Choose Aruba for Your Next All-Inclusive Getaway?”: An engaging infographic or interactive content piece illustrating the unique attractions of Aruba, comparisons with other Caribbean destinations, and the advantages of choosing an all-inclusive package, emphasizing the convenience of flying with Caribbean Airlines.
- “Customer Stories: Unforgettable Moments at Aruba’s All-Inclusives”: A collection of customer testimonials and stories shared through blog posts or social media content, capturing personal experiences, highlights, and recommendations for all-inclusive stays in Aruba, encouraging viewers to book their next adventure with Caribbean Airlines.
- “Travel Podcast”: Seek out Top Travel Podcasters globally, CAL can offer to sponsor an episode (or a series of episodes) dedicated to Aruba. This sponsorship could include covering the podcaster’s trip to Aruba, in exchange for in-depth coverage of the experience, from flights with Caribbean Airlines to exploring the island’s all-inclusive resorts. This is a great way to tap into podcast platforms like Apple Podcast and Spotify.
This will give them the ability to run ads against the content on platforms like Google Ads and run social media ads for the top performing content.
“Aruba All Inclusive Ideas”
This is how it goes when you are doing your data research, we dive deeper and deeper into the audience demographics Search Terms, we look at supporting queries, look at their age demographics, and we can now craft the right content for each age group and get more specific on the Copywriting but also on the Ad parameters we set per keyword on Google Ads and on social media ads.


Content Ideas Per Age Demographic
Under 18:
- Content: Interactive quizzes on Aruba’s wildlife and marine life.
- Platform: YouTube, TikTok
- Type: Educational animations and challenge videos to spot certain animals or landmarks.
Ages 18-24:
- Content: Guides to budget-friendly Aruba adventures, including free beaches and local eateries.
- Platform: Instagram, TikTok
- Type: Dynamic vlogs and carousel posts with tips and tricks for affordable travel.
Ages 25-34:
- Content: Stress-relief and wellness content centered around Aruba’s natural beauty and tranquility.
- Platform: Instagram, Facebook
- Type: Relaxing slideshows of serene landscapes and wellness tips with tranquil music.
Ages 35-44:
- Content: Family vacation planning tips, highlighting year-round activities in Aruba for all ages.
- Platform: Facebook, Pinterest
- Type: Infographics and video content with family packing lists, itineraries, and activity ideas.
Ages 45-54:
- Content: Culinary journey through Aruba, featuring traditional dishes and recipes.
- Platform: Facebook, Pinterest
- Type: Photo carousels of local cuisine, recipe videos, and cooking tips from Aruban chefs.
Ages 55-64:
- Content: Narratives and stories of Aruba’s history, landmarks, and cultural heritage.
- Platform: Facebook, YouTube
- Type: Documentary-style videos and photo posts with rich historical context and storytelling.
65 and older:
- Content: Relaxing and gentle activities in Aruba, such as bird watching, art galleries, and gentle yoga on the beach.
- Platform: Facebook, YouTube
- Type: Slideshow videos with voiceovers, photo posts with detailed explanations, and gentle instructional videos.
These content ideas are designed to be relevant and engaging at any time, providing value and sparking interest in Aruba’s offerings for various age groups year-round. When you create the right content to match the search intentions from the countries you are looking to build a presence in and then target ads to that specific demographic, you stand a much higher chance of creating engaging content and finding success.
Not to mention if you create the content and distribute it across all the platforms that are indexed by the search engines like Blogs, YouTube, Images (Think reverse searches), Google Webstories and much more…It will drive traffic to your platforms for years to come.
Did you enjoy this case study? I hope you gleaned some insights from some of the best in the business. If you are looking to have digital research done for your business and the landscape, reach out and learn about our rates to have this done for you as well —> Contact us.
If you want more content on building your digital presence check me out on social media – Linkedin, Instagram, TikTok.