
For years, Trinidad’s amazing food scene has unfolded on our screens thanks to a passionate crew of our food content creators, who have showcased the culinary delights of Trinidad and Tobago to the world. They’ve become our trusted guides, leading us on adventures and exposing us to hidden gems.
But with so much delicious content, the debates have grown louder over the years – who’s the top Food Content Creator? This burning question sparked this in-depth case study.
We’ll be dissecting the social media empires of HungryBelly868, EatAhFood, Rendelina Reviews, FoodienationTT, and Foodie Tales with Zaak. We’ll dive into their numbers, analyze their engagement strategies, and uncover who truly resonates with the Trinidadian foodie crowd.
As always, the goal is to gain insights and see what we can learn from some of the top creators in this niche. We’ll explore their content consistency, engagement tactics, and approach their content from a fresh paradigm. This, my friends, is your golden opportunity to learn from the best and elevate your own content game.
So, grab your phone, fuel your foodie curiosity, and get ready to embark on this delicious journey!
Data Snapshot: April 2024! This analysis is based on social media activity between March 30th and April 28th, 2024. Remember, by the time you’re reading this, the numbers might have shifted a bit in the real world.
Who Has The Highest Following Amongst The Group?
We’ve crunched the numbers on the top food content creators, and here’s the data:
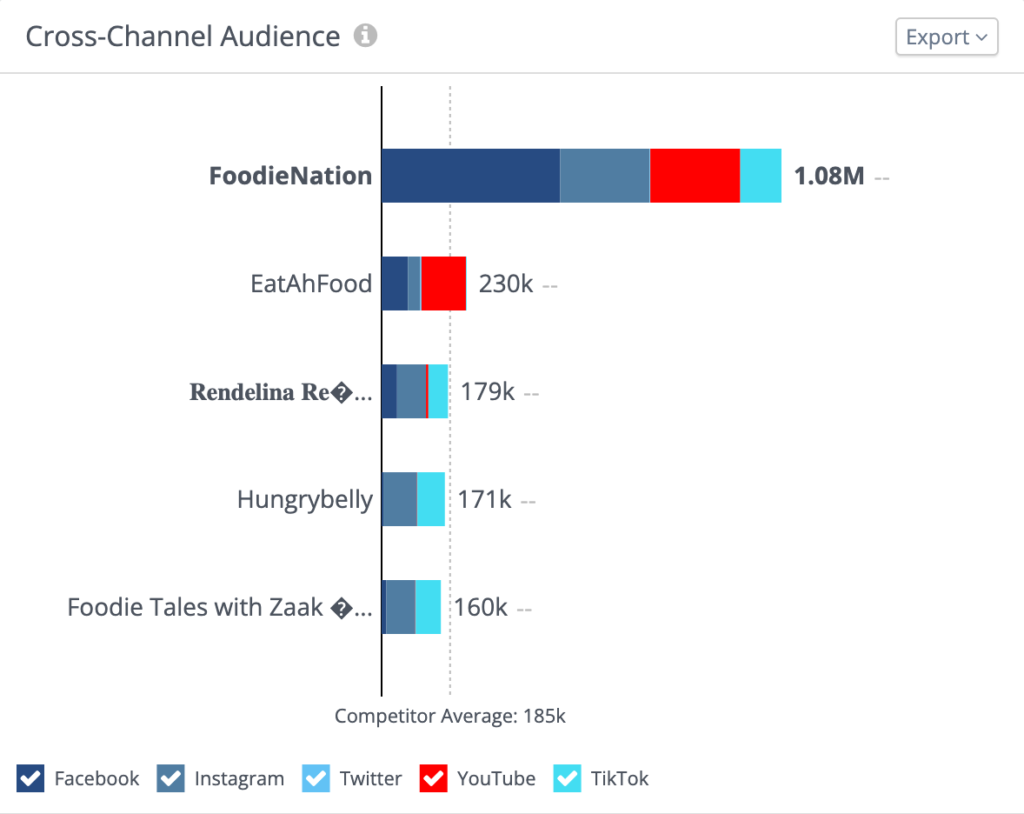
FoodieNation emerges as the reigning champion, boasting a colossal 1,079,363 total followers across platforms. This dominance speaks volumes about their multi-platform strategy, with a strong presence on:
- Facebook: 481,952
- Instagram: 241,572
- Twitter: 1,681
- YouTube: 243,000
- TikTok: 111,158
EatAhFood takes the silver medal with a respectable 229,585 followers. Their content resonates particularly well on YouTube, where they have 120,000 subscribers. Here’s their platform breakdown:
- Facebook: 71,090
- Instagram: 33,092
- Twitter: 3,468
- YouTube: 120,000
- TikTok: 1,935
Rendelina Reviews nabs the bronze with 179,189 followers, with a focus on visual content evident in their strong Instagram presence of 78,002 followers. Their reach across platforms includes:
- Facebook: 41,779
- Instagram: 78,002
- Twitter: 77
- YouTube: 6,420
- TikTok: 52,911
Hungrybelly follows closely behind with 170,711 followers, with Instagram being their go-to platform. Here’s their audience distribution:
- Facebook: 4,790
- Instagram: 90,808
- YouTube: 993
- TikTok: 74,120
Foodie Tales with Zaak rounds out the top five with a total audience of 160,022. Their strong presence on Instagram (78,051) and TikTok (68,068) suggests they’ve captured the attention of a younger, visually-oriented audience. Here’s their platform breakdown:
- Facebook: 12,988
- Instagram: 78,051
- YouTube: 915
- TikTok: 68,068
The Takeaway:
These numbers paint a delicious picture of the diverse strategies employed by Trinidad’s top food content creators. We can see the importance of platform variety, focused content, and catering to specific audience preferences.
This is just the first course! Stay tuned as we delve deeper, analyzing their engagement tactics and content styles to unlock the secrets of their success. Let’s learn valuable tips to turn your own food content into a culinary masterpiece!
Total Amount of Posts in the Last 30 Days
We analyzed the posting habits of Trinidad’s top food influencers, and the results are intriguing.
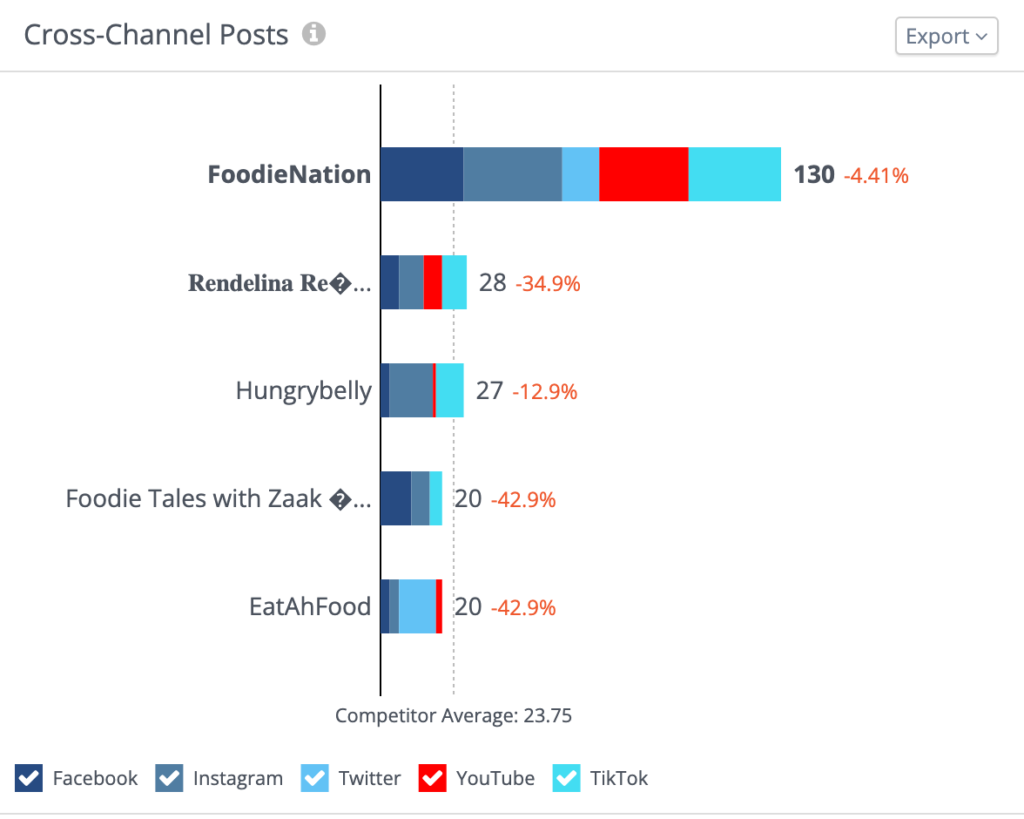
FoodieNation has the highest posting total (130!), suggesting a highly active, multi-platform strategy. However, a slight dip of 4.41% compared to their previous output hints at a potential shift in their posting frequency. We know that Shaun and Rhett have their own personal pages that have been posting a lot, which could explain the dip in the main page.
Rendelina Reviews follows closely with 28 posts, but a significant drop of 34.9% raises questions. Are they in the midst of a strategic change, or perhaps taking a content creation break?
Hungrybelly falls near the group average (27 posts) with a more modest decrease (12.9%).
Foodie Tales with Zaak and EatAhFood both landed at 20 posts but with a staggering 42.9% decline for each.
The average number of posts across the group sits at 23.75, providing a benchmark for comparing individual activity levels. This data paints a picture of varied engagement and possible strategic shifts happening on these creators’ social media channels. These content creators also have other pages they post to and activities that are happening outside of social media that may have impacted their output in terms of posts.
At least you have an idea as to how many times the top content creators are posting, in order to find success online.
The Total Engagement Across All Social Media Channels
Now it’s time to look at the Overall Engagement of these Food Content Creators across all of their social media platforms. Engagement is one of the most important metrics to look at because as we have seen in previous case studies, the platforms with the largest followings and who have the highest output, don’t always have the largest engagement and the smallest creators have been able to outperform those with millions of followers and those who have posted more than them.
Let’s take a look and see what is going on with this group.
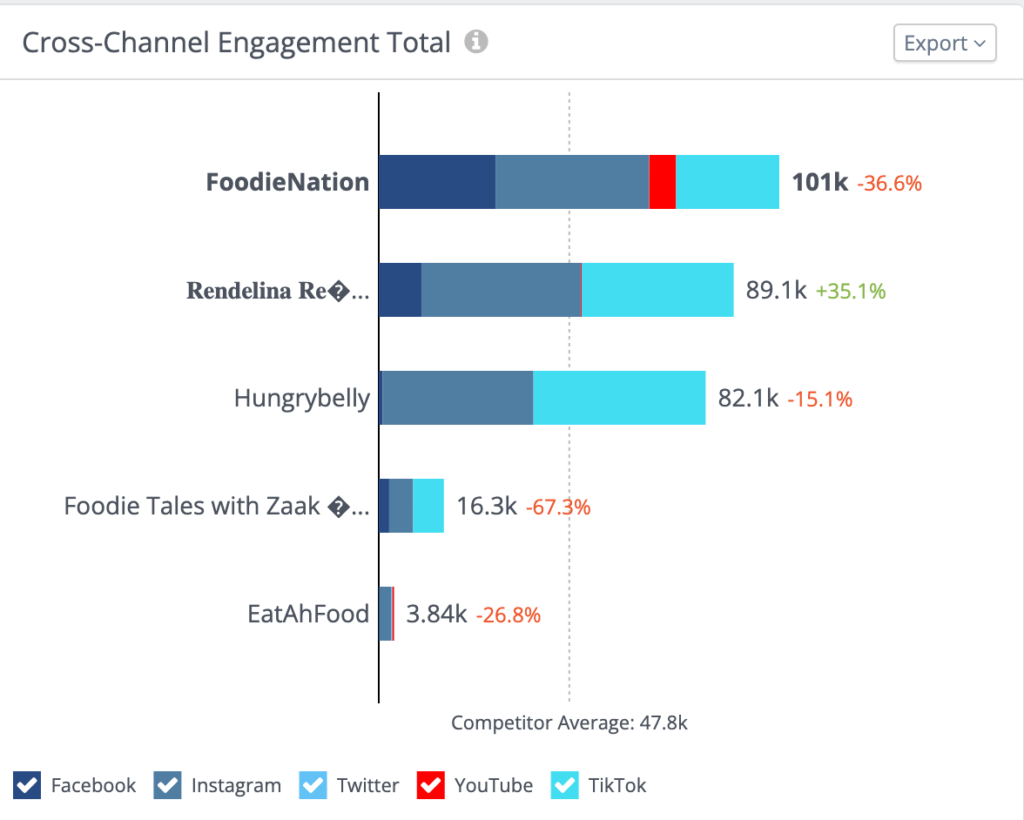
FoodieNation (Total: 100,557 Engagements; Change: -36.6%)
FoodieNation not only had the most amount of posts (130!) and the largest following but they also have been able to generate the highest engagement. Their audience support is strong across multiple platforms (Facebook: 29,318, Instagram: 38,553, TikTok: 25,913) with Instagram and TikTok being their most engaging channels. However, a substantial decrease in overall engagement (-36.6%) shows that maintaining high numbers can be challenging even for the best of creators.
Rendelina Reviews (Total: 89,098 Engagements; Change: +35.1%)
Rendelina Reviews (Total Posts: 28) is on a roll, experiencing a significant increase in engagement (+35.1%)! Their most engaged audiences have come on platforms like Instagram (39,828) and TikTok (38,177), indicating their content is resonating with the audience.
Hungrybelly (Total: 82,065 Engagements; Change: -15.1%)
Hungrybelly (Total Posts: 27) maintains a healthy engagement (Facebook: 954, Instagram: 37,883, TikTok: 43,223) with TikTok and Instagram leading the charge. While there’s a slight decline (-15.1%), there’s still room for strategic tweaks to maximize engagement and potentially surpass past levels.
Foodie Tales with Zaak 🇹🇹 (Total: 16,347 Engagements; Change: -67.3%)
Foodie Tales with Zaak 🇹🇹 (Total Posts: 20) has experienced a significant drop in engagement (-67.3%), particularly on TikTok (7,714), their most engaging platform. This could reflect changes in audience preferences or a content strategy shift that hasn’t quite landed with their followers.
The Verdict:
The average engagement interactions for the group sit at 47.8k, which serves as a middle ground, showing the typical performance among the creators. This average provides a benchmark, indicating that while some creators like FoodieNation and Rendelina Reviews are performing well above this mark, others, notably Foodie Tales with Zaak 🇹🇹, are currently below, suggesting potential areas for growth or strategy adjustment.
Avg Engagement Per Post
This section breaks down what is the average interaction on singular posts these content creators have received in the last month. Whilst the previous section calculated the total amount of engagement for the last 30 days, this will give you an idea of what type of engagement you can expect per post when working with these creators.
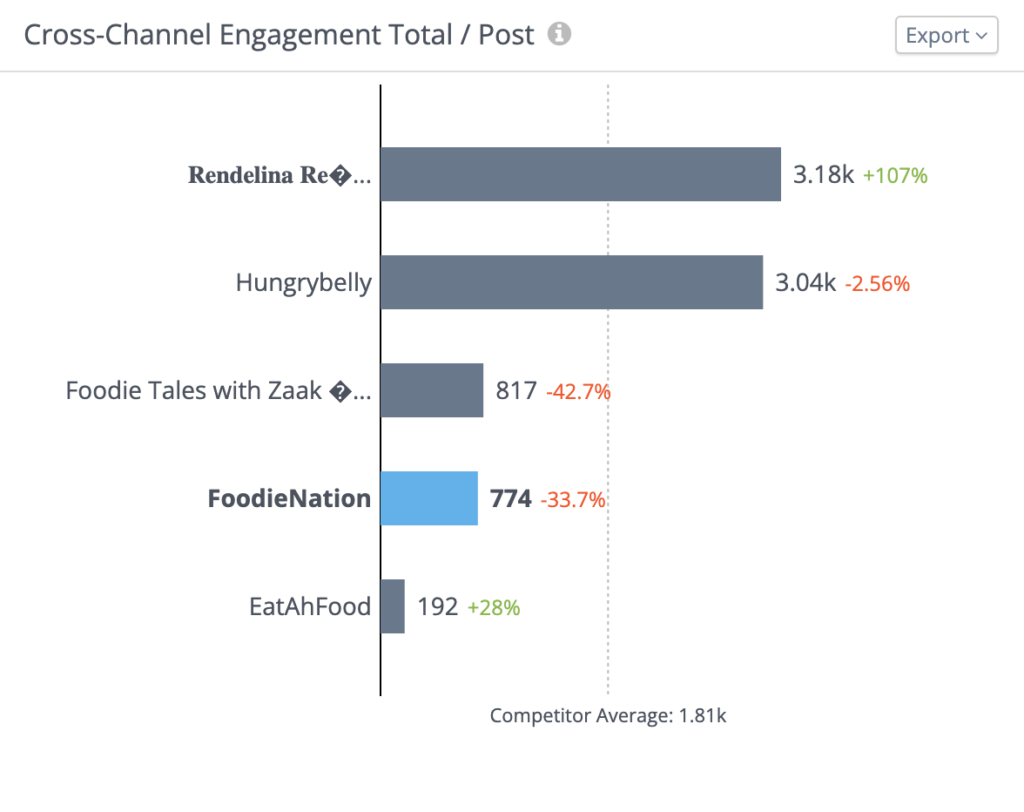
Rendelina Reviews emerges as the clear winner, boasting a whopping 3.18k average engagement per post! This translates to a massive 107% increase from before, proving their content truly resonates and sparks conversation.
Hungrybelly maintains a consistent performance with a 3.04k average engagement per post, experiencing only a slight 2.56% dip. This speaks volumes about their ability to keep their audience hooked.
Foodie Tales with Zaak 🇹🇹 unfortunately faces a decline in engagement, averaging only 817 per post, a 42.7% decrease. This suggests their past strategies might not be hitting the spot with audiences anymore.
FoodieNation, despite their large following, sees a drop to 774 average engagements per post (down 33.7%). This could prompt the team to look at their CTAs and make sure that encourage the audience to interact with every post across their platforms so that they can raise this average up.
On the bright side, EatAhFood, while having the lowest average engagement (192 per post), shows a promising 28% increase.
Highest Likes & Post Reactions Across Social Media
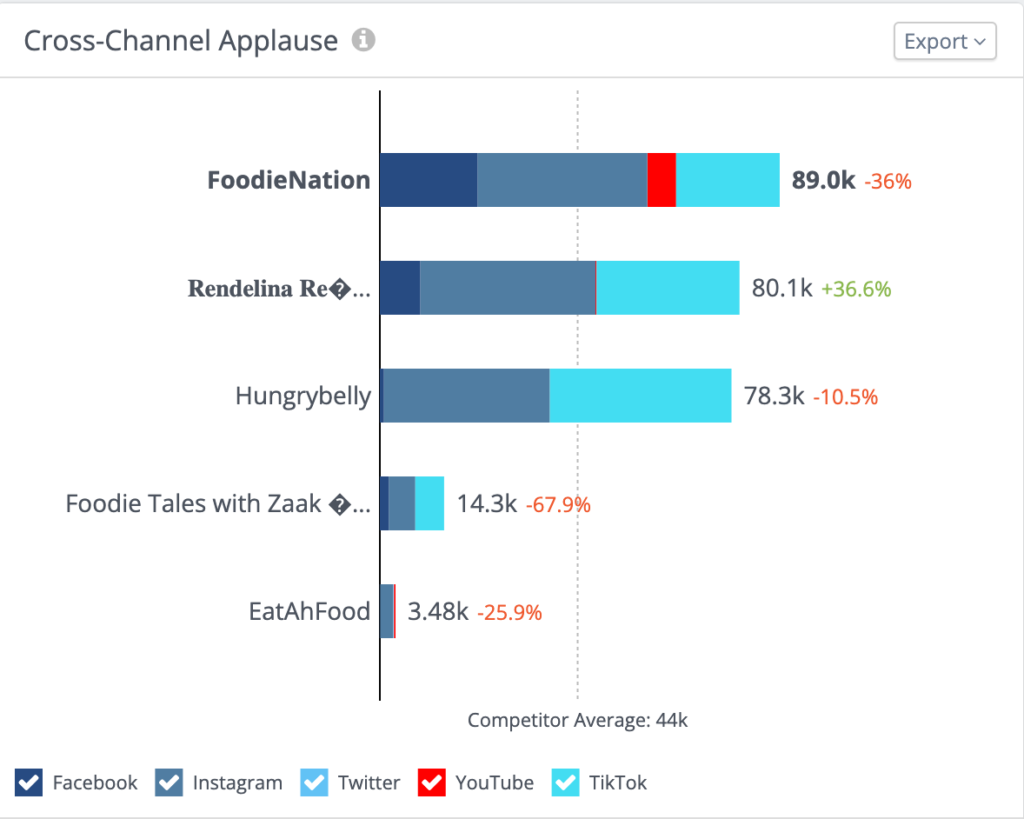
Now we look at who has been able to rack up the most likes and post reactions across all social media channels over the last 30 days:
FoodieNation still holds the crown for total applause (89,000), even though it’s dipped by 36%. They can review their posts from February and see what differences they did in their content and where the 36% drop in likes/reactions stemmed from.
Rendelina Reviews is on a roll, experiencing a positive feedback explosion! A 36.6% increase to 80.1k claps suggests their content is hitting all the right notes with their audience.
Hungrybelly maintains a decent showing with 78.3k post likes/reactions (a slight 10.5% decrease). While there’s a minor shift, their content strategy seems to be keeping their audience engaged.
Foodie Tales with Zaak 🇹🇹 needs to review his content plan. In March there was a 67.9% drop in likes/reactions (only 14.3k!). Time to brainstorm and come up with new ways to win back the hearts (and stomachs) of his followers.
EatAhFood, while having the lowest number of claps (3.48k with a 25.9% decrease), they need to evaluate their content strategy. They have a large follower base and need to figure out how to reengage their audience.
Most Comments Across All Social Media Channels
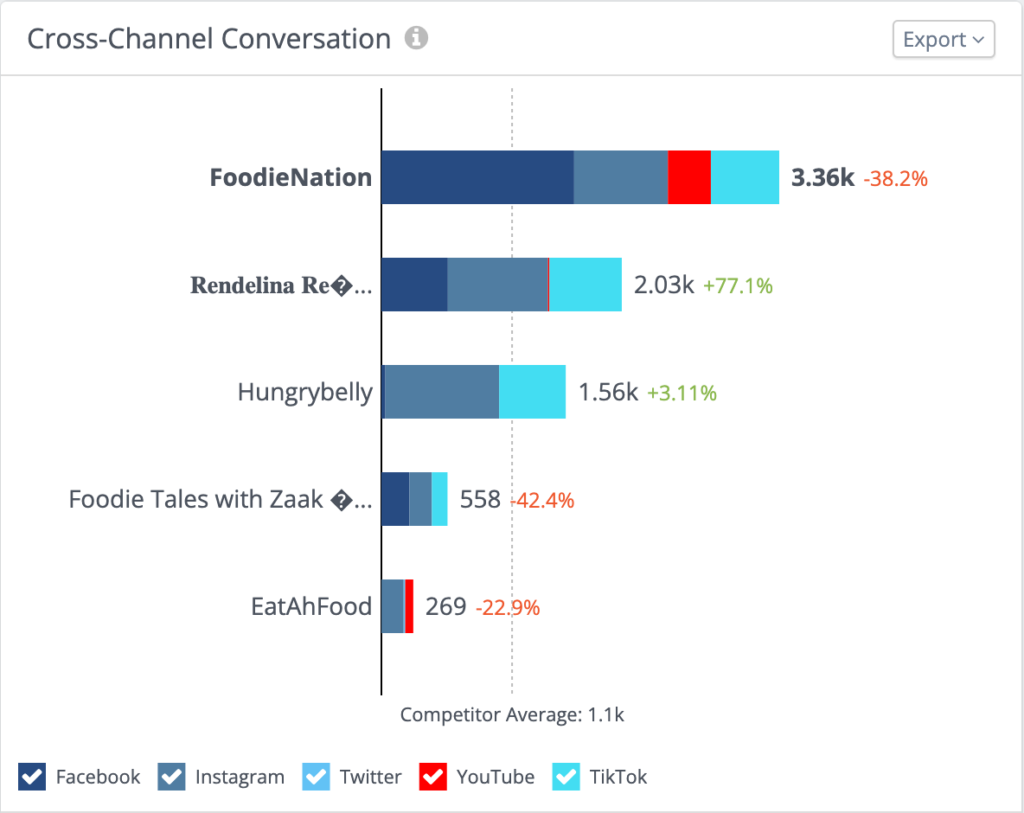
This section will break down who has had the most comments, sparking the most conversations across all social media channels. It takes extra effort for your audience to leave a comment, so this metric is something we weigh higher than just a like or reaction on a post. Check out the numbers:
FoodieNation still holds the conversation crown with 3.36k comments but with a concerning 38.2% drop. This suggests, that while their content sparks discussion, a 38.2% drop is a big deal but I am positive they will be revisiting their performance in February to see the differences in their content to what led to the drop in comments in March.
Rendelina Reviews is once again on the rise! Their comment volume skyrocketed by an impressive 77.1% to 2.03k. This surge in audience interest translates to a thriving community actively discussing and engaging with their content.
Hungrybelly fosters a stable and growing conversation with their audience. A slight increase of 3.11% brings their comment volume to 1.56k, signifying a focus on building a community that actively interacts.
Foodie Tales with Zaak 🇹🇹 needs to address a potential disconnect. A significant 42.4% decline in comments (only 558!) suggests their content might not be sparking conversations the way it used to.
EatAhFood faces challenges in igniting discussions with their content. Their comment volume sits at 269, experiencing a decrease of 22.9%. They need to maximize that 230k following and create the content that will get them to engage. A major drop in Likes/Reactions and Comments warrants a sitdown and rethink of their content strategy.
The Total Amount of Shares Across Applicable Social Media Channels
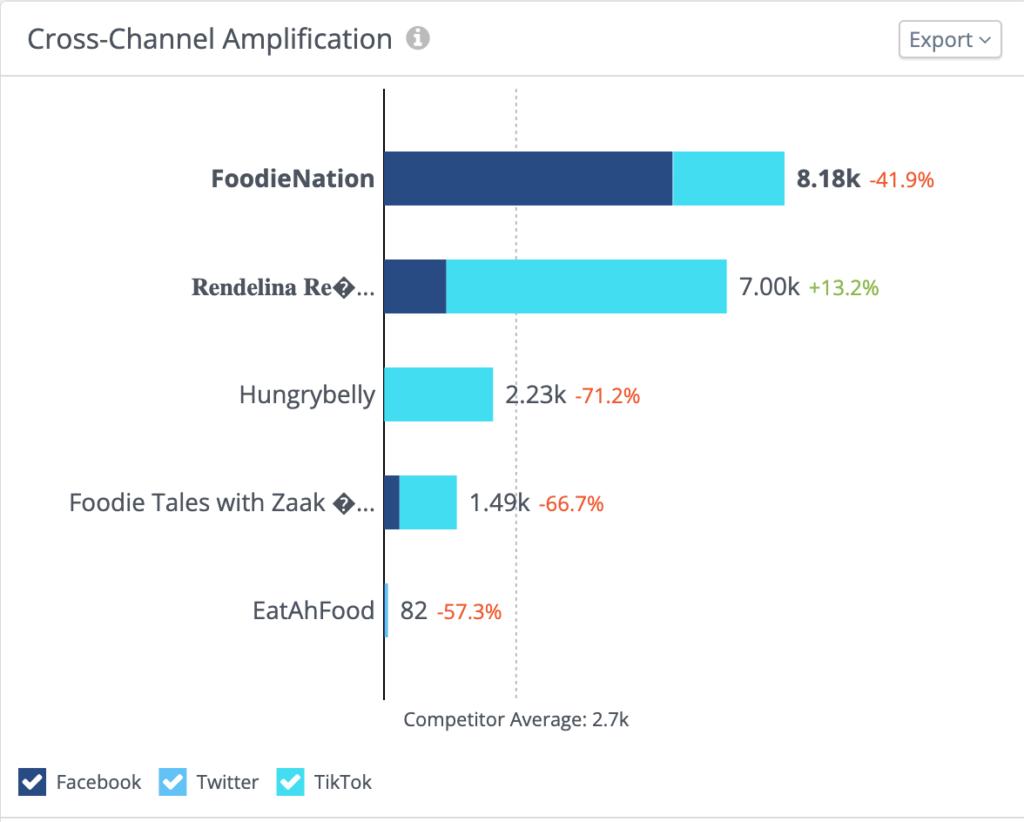
Now we look at Facebook shares, Twitter retweets, and TikTok shares – the ultimate sign that your audience is feeling your content.
FoodieNation, despite their large audience, has seen a 41.9% drop in shares, sitting at 8.18k. This could indicate a recent decline in content shareability. Facebook has been their top platform for shares with 5,894 on FB.
Rendelina Reviews is spreading the food love! Their content amplification has seen a 13.2% increase, reaching 7k shares. TikTok has been really good for them, generating 5,726 shares in the last 30 days.
Hungrybelly needs to spice things up a bit! Their share volume has significantly dropped by 71.2%, landing at 2.23k. This could be a sign that their content isn’t quite hitting the mark, or maybe it’s not reaching the right audience.
Foodie Tales with Zaak 🇹🇹 also faces a sharing slump. A major 66.7% drop (only 1.49k shares) suggests their content needs a refresh to spark that “shareable” spark.
EatAhFood, with the lowest share count (82) and a 57.3% decrease, faces the biggest challenge in creating content that ignites audience sharing.
The Top Posts In The Last 30 Days
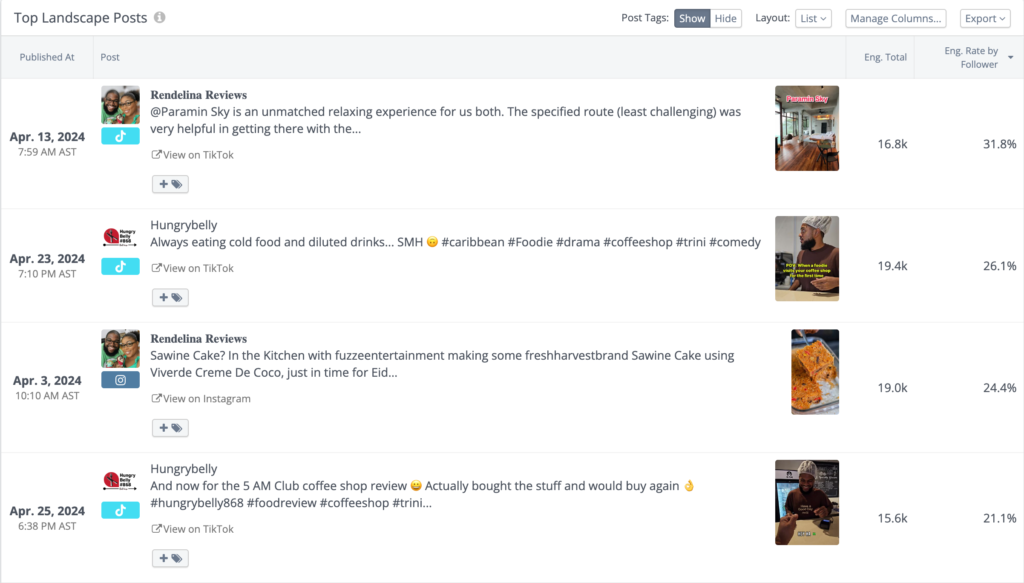
We’ve analyzed the “Top Landscape Posts” from our favourite Trinbago food influencers, Rendelina Reviews and Hungrybelly, have captured the top spots.
Rendelina Reviews is a master of capturing both the beauty of the island and the deliciousness of its food. Their top post, dated April 13th, 2024, transported their audience to a state of relaxation at Paramin Sky, racking up a whopping 16.8k engagements with a 31.8% engagement rate by follower. Clearly, their audience craves that escape!
But fear not, food lovers! Rendelina Reviews hasn’t forgotten their roots. Their other top post (3rd Best Performing), dated April 3rd, 2024, showcased a delectable creation: the Sawine Cake. This mouthwatering masterpiece garnered 19k engagements with a 24.4% engagement rate, proving that food is still king (or queen) on their channel.
Hungrybelly knows how to tickle the funny bone (and the taste buds) of their audience. Their top post (2nd Best Performing Overall), dated April 23rd, 2024, took a humorous look at how restaurant owners act when they know a Foodie is at their restaurant, creating content but taking long to eat and drink the actual food, which could result in a bad review by the time they get around to consuming, this racked up 19.4k engagements at a 26.1% rate. It also helps that they had another popular creator in the mix, Kyle Boss. Don’t forget to check out his new Coffee Shop, The 5AM Club.
But Hungrybelly isn’t all jokes. Their second top post, dated April 25th, 2024, reviewed Kyle Mark aka Kyle Boss coffee shop, pulling in 15.6k engagements with a 21.1% rate. This suggests their audience values their insights on the local dining scene.
Activity and Engagement Rate By Follower
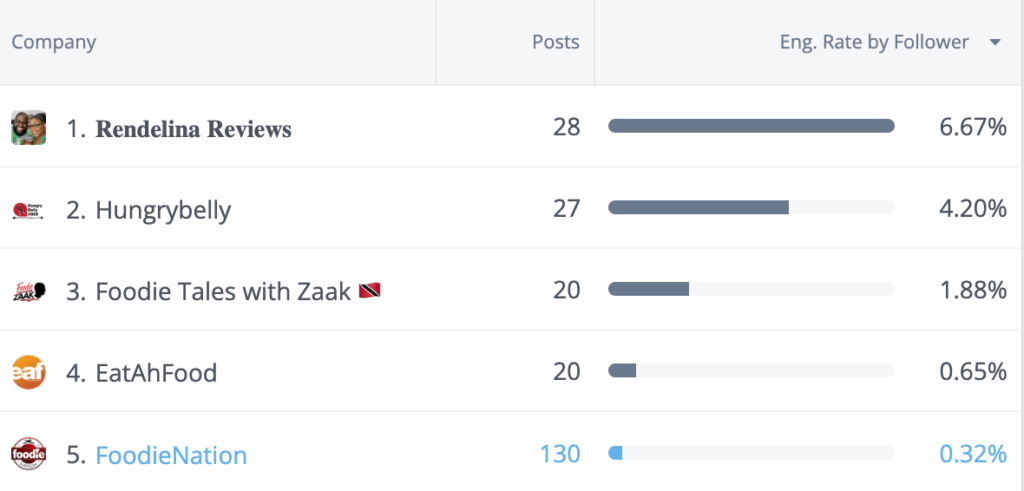
Rendelina Reviews emerges as the clear champion! With a stellar 6.67% engagement rate across their 28 posts, their content truly resonates with their audience, sparking conversation and interaction.
Hungrybelly follows closely with a 4.20% engagement rate on their 27 posts.
Foodie Tales with Zaak 🇹🇹 is putting out content (20 posts), but it might not be hitting the spot with viewers. Their engagement rate sits at a lower 1.88%, this would be a good time try some new engagement strategies.
EatAhFood faces a similar challenge. While they match Foodie Tales with Zaak in post count (20), their engagement rate is significantly lower at 0.65%. This suggests that their audience is potentially no longer in tune with the content being created.
FoodieNation might be surprised to learn that despite having the highest volume of posts (130!), they have the lowest engagement rate at a mere 0.32%.
Engagement rate by follower measures how well your social media content connects with your audience compared to your following size. It’s like a popularity contest but for your content!
Why it matters: It shows how effective your content is, not just how popular you are.
Good rate: Above 5% is stellar, 1-5% is good, below 1% needs work.
How to improve it: Post consistently, ask questions, check out ManyChat work that into your strategy if applicable and respond to comments. Basically, be engaging yourself!
You also need to audit your Followers, there are many bots that follow us, 1 person following from multiple accounts and also people who Followed us at one point but then dropped off. If you have to many people following you that don’t engage, ultimately this will bring down your engagement rate and can send the wrong signals to the social media algorithm.
Engagement By Social Media Platform
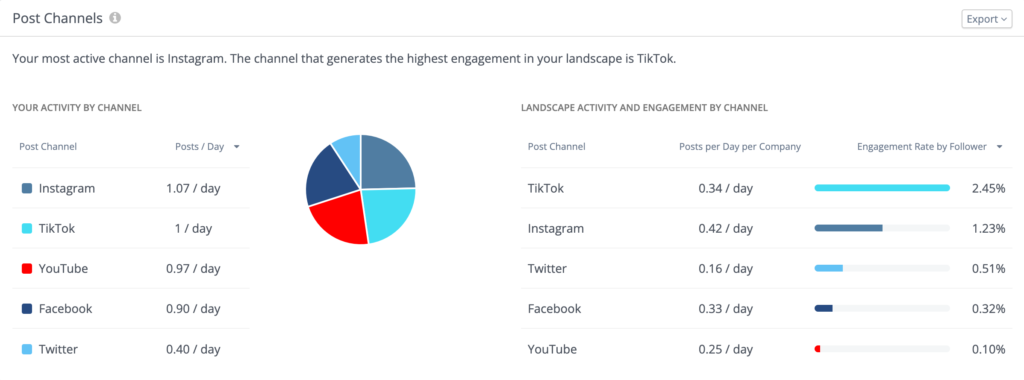
On the left-hand side where it says “Your Activity by Channel”, that data is specific to Foodie Nation as they are my Content Creator in focus. Foodie Nation’s most active channel was Instagram with 1.07 posts per day but TikTok was the platform that generated the highest engagement for the entire landscape.
Let’s dive deeper into the landscape numbers.
TikTok generated the highest engagement rate with 2.45%, even though content isn’t posted daily (average: 0.34 posts). This means their content truly hits the spot with viewers!
Instagram follows closely with a solid 1.23% engagement rate, bolstered by a consistent posting frequency (0.42 posts daily). The entire landscape posted to Instagram more than any other platform.
Twitter, despite the least frequent posting (0.16 posts daily), manages a respectable 0.51% engagement rate. Looks like short and sweet tweets still have impact.
Facebook (0.32% engagement rate, 0.33 posts daily) might need a recipe revamp. The landscape on the whole will need to rethink how they approach Facebook, out of the group, we know Foodie Nation has found the most success on Facebook.
YouTube brings up the rear with a 0.10% engagement rate (almost a quarter of a post daily). Everybody should keep in mind that YouTube content has the highest shelf life, learning some SEO and best Search Practices can help to drive more traffic to YouTube. Not to mention, YouTube is still the only platform in the Caribbean paying content creators.
The Engagement Rate of Various Content Types
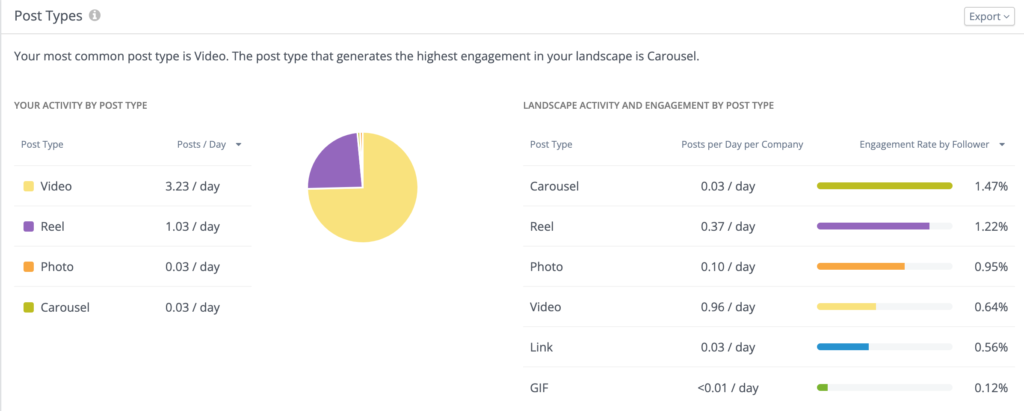
On the left-hand side, we see a breakdown of what type of content Foodie Nation has created over the last 30 days. Their focus has been on Video Content but it has been the Carousel content that has generated the highest engagement for the landscape. Let’s take a look further:
Carousel Craze: While rare (only 0.03 posts per day), carousels reign supreme with a 1.47% engagement rate. People love them, even if they don’t see them often!
Reel Recognition: Next up are Reels, with a more frequent appearance (0.37 posts per day) and a strong 1.22% engagement rate. They’re a great way to grab attention and keep followers hooked.
Photo Power: Classic photos, posted at a moderate rate (0.10 per day), still hold their own with a decent 0.95% engagement rate. They might not be fancy, but they get the job done.
Video Overload?: Videos are king in terms of posting frequency (a whopping 0.96 per day), but their engagement rate falls short at just 0.64%. Videos would be classified as anything over 90 seconds. Reels have been doing better, maybe the group can produce more Reel Content and get tighter on their video edits.
Link Limbo & GIF Gaffe: Links (0.03 posts per day, 0.56% engagement) and GIFs (practically nonexistent, 0.12% engagement) bring up the rear. Focus on the content that truly sparks conversation!
Posting Dates, Times and Measuring Engagement For The Group
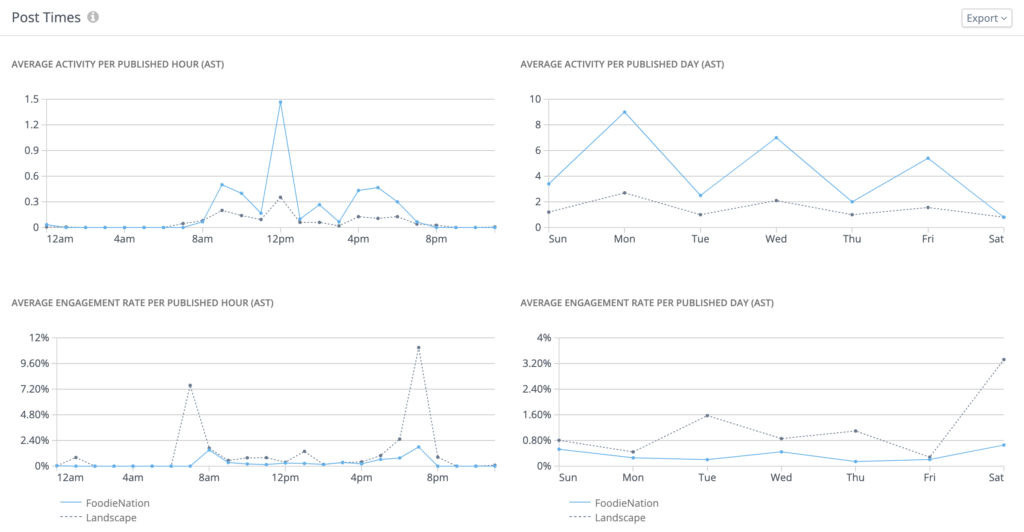
We’re diving into posting time and audience engagement!
Timing for Posting:
- FoodieNation: They strategically target afternoons, with a peak posting time at 12 PM AST.
- The Landscape: Everyone else posts more spread out, with a major peak around 2 PM AST.
- It looks like everybody is targeting breakfast, lunch and dinner times since the spikes all happen around those times.
Engagement Sweet Spot:
- FoodieNation: Foodie Nation’s audience tends to engage with their content most around 8am and 7pm.
- The Landscape: Engagement for everyone else spikes at 7am and 7pm.
Weekly Posting Patterns:
- Activity: Foodienation’s peak posting days are Monday, Wednesday and Friday.
- The Landscape: The rest of the group’s posting days reflect the same as Foodie Nation, Mon, Wed and Fri.
Let’s Recap
- Most Followers – Foodie Nation
- Most Posts – Foodie Nation
- Highest Total Overall Engagement – Foodie Nation
- Highest Engagement Per Post – Rendelina
- Most Likes – Foodie Nation
- Most Comments on Content – Foodie Nation
- Most Shares – Foodie Nation
- Highest Engagement Rate Per Follower – Rendelina
- Top Performing Singular Post in The Last 30 Days – Rendelina
Raise a fork (or phone) to these Trinbago Food Content Creators! FoodieNation, EatAhFood, Rendelina Reviews, Hungrybelly, and Foodie Tales with Zaak 🇹🇹 have built incredible online communities through dedication, hard work, and strategic content creation.
Their success isn’t an accident. It’s a delicious blend of engaging content and meaningful connections with their audience.
This isn’t the end, it’s the beginning! Use this analysis as a springboard. Become a student of their craft. Pick apart their strengths that drive engagement, and don’t be afraid to learn from their setbacks. Every post, comment, and engagement fluctuation is a golden nugget of social media wisdom.
Turn insights into action! Take notes, analyze their strategies, and figure out what works for you. Every peak and valley in their journey reveals secrets about the ever-changing world of online engagement.
Thank you for joining this exploration! We hope you’re not just informed, but inspired! Keep learning, keep creating, and keep connecting as you build your own online food empire. Until next time, happy scrolling (and maybe some snacking)!
Is your organization looking to do audience research or competitive analysis? Feel free to reach out to me here —> Contact Me.