
Jamaica is a vibrant island nation known for its rich culture, stunning landscapes, and of course, its powerhouse women. But these women aren’t just making waves in traditional spheres – they’re also dominating the social media landscape.
This case study delves into the strategies of 5 of Jamaica’s Powerhouse Women: Tami Chin-Mitchell, Yendi Phillips, Kalilah Reynolds, Dr. Terri-Karelle Reid, and Krystal Tomlinson. Forget picking a winner – our focus is on unlocking the insights behind their success.
We’ll analyze their social media presence, dissect their winning tactics, and identify the key elements that propel them to the forefront of their respective fields. This isn’t just about admiring their achievements; it’s about gleaning valuable takeaways that you can implement and adapt to elevate your own digital strategy.
So, buckle up and get ready to be inspired! By exploring the social media mastery of these Jamaican trailblazers, you’ll discover actionable strategies to help you conquer your own corner of the digital world.
Data Snapshot: April 2024! This analysis is based on social media activity between March 26th and April 24th, 2024. Remember, by the time you’re reading this, the numbers might have shifted a bit in the real world.
Who Has The Highest Following Amongst The Group?
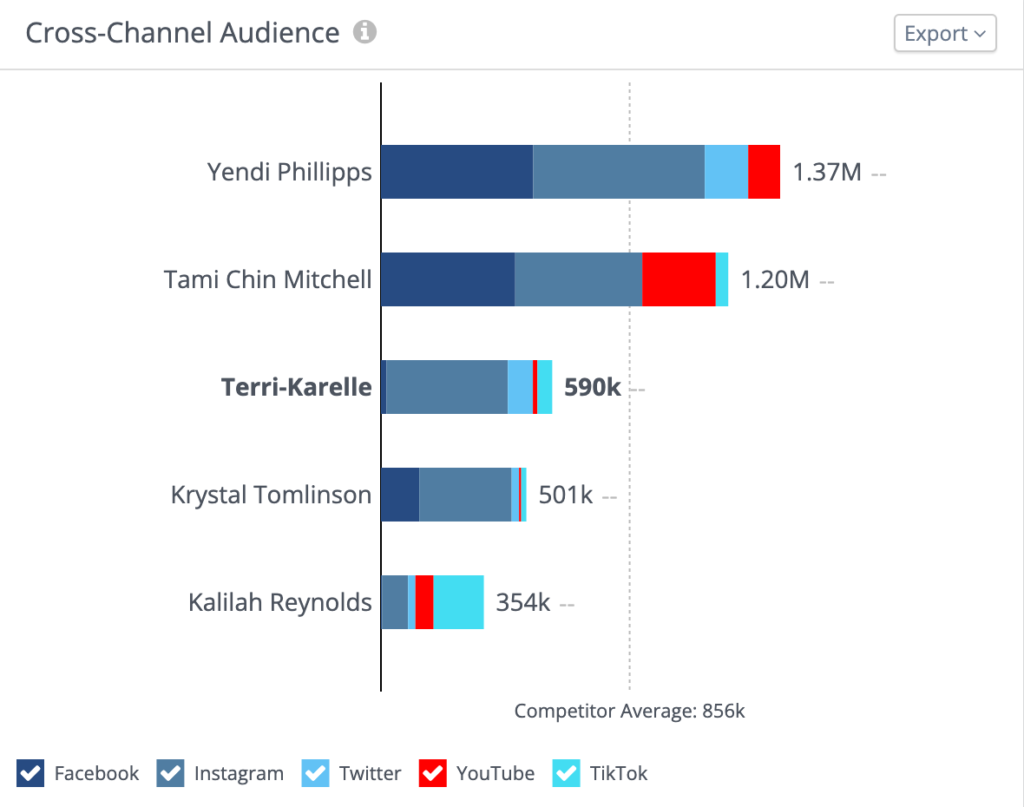
Across various social media platforms, Jamaica’s Powerhouse Women have cultivated impressive followings, each demonstrating a unique approach to audience engagement.
Yendi Phillipps and Tami Chin Mitchell have established a robust presence on major platforms like Facebook and Instagram. Yendi leads the pack with over 1.37 million followers, with a strong showing on both Instagram (590,927) and Facebook (524,060). Tami mirrors this success (Facebook: 462,289, Instagram: 437,399) and additionally boasts a sizable YouTube following (253,000) – a testament to her engaging video content.
Terri-Karelle’s audience primarily resides on Instagram (417,787), suggesting her content thrives in that visual space. While her presence on Facebook (19,170) and Twitter (86,135) is more modest, it still reflects a well-rounded social media strategy.
Krystal Tomlinson showcases a balanced approach across Facebook (132,112) and Instagram (317,961), demonstrating her ability to connect with audiences on both platforms. While her YouTube and TikTok presence (7,290 and 17,740 respectively) is less prominent, it still offers additional avenues for audience engagement.
Kalilah Reynolds is killing it on TikTok (172,931 followers), proving she understands her audience! She’s also cultivating a money-focused community on YouTube (62,600) and boasts a strong following on Instagram (89,620). While Facebook (3,666) is her quietest platform, it still contributes to her impressive social media reach.
Each of these women showcases a distinct approach to social media, offering valuable insights for building your own online presence. By understanding your target audience and the strengths of each platform, you can cultivate a winning strategy and connect with your followers in meaningful ways.
Total Amount of Posts in the Last 30 Days
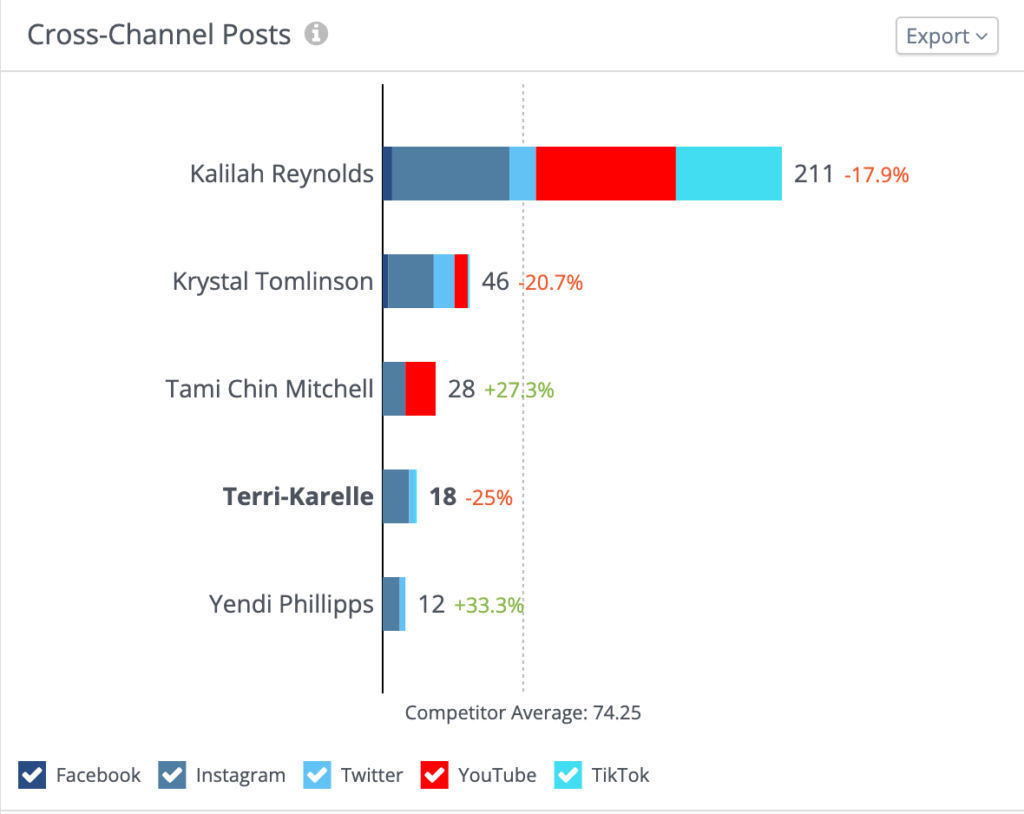
Let’s delve into the posting habits of these influential Jamaicans! Analyzing their social media activity provides insights into their unique strategies.
Kalilah Reynolds takes the lead with 211 posts, showcasing a consistent commitment to engaging her audience. Interestingly, her posting frequency has dipped slightly (17.9%). This could indicate a shift in her strategy, perhaps focusing on higher-quality content or exploring different platforms.
Krystal Tomlinson has also adjusted her approach, with a decrease of 20.7% in posts (46 total). This might suggest a focus on longer-form content or a strategic pause to refine her content plan.
Tami Chin-Mitchell, on the other hand, has ramped up her posting frequency by an impressive 27.3% (28 posts). This is a great example of experimentation and finding a rhythm that resonates with her audience.
Terri-Karelle Reid’s activity has seen a reduction of 25% (18 posts). This doesn’t necessarily indicate a decline, but could reflect a more curated approach to content selection.
Yendi Phillipps, while having the fewest posts (12), has shown the most significant increase (33.3%). This could be a strategic decision to build a stronger online presence and connect more actively with her audience.
The wide range of posting frequencies – from Kalilah’s consistent output to Yendi’s strategic increase – highlights the diverse approaches these women take to social media. Analyzing their impact and effectiveness will be a fascinating part of this case study, offering valuable lessons for anyone looking to build a strong online presence.
The Total Engagement Across All Social Media Channels
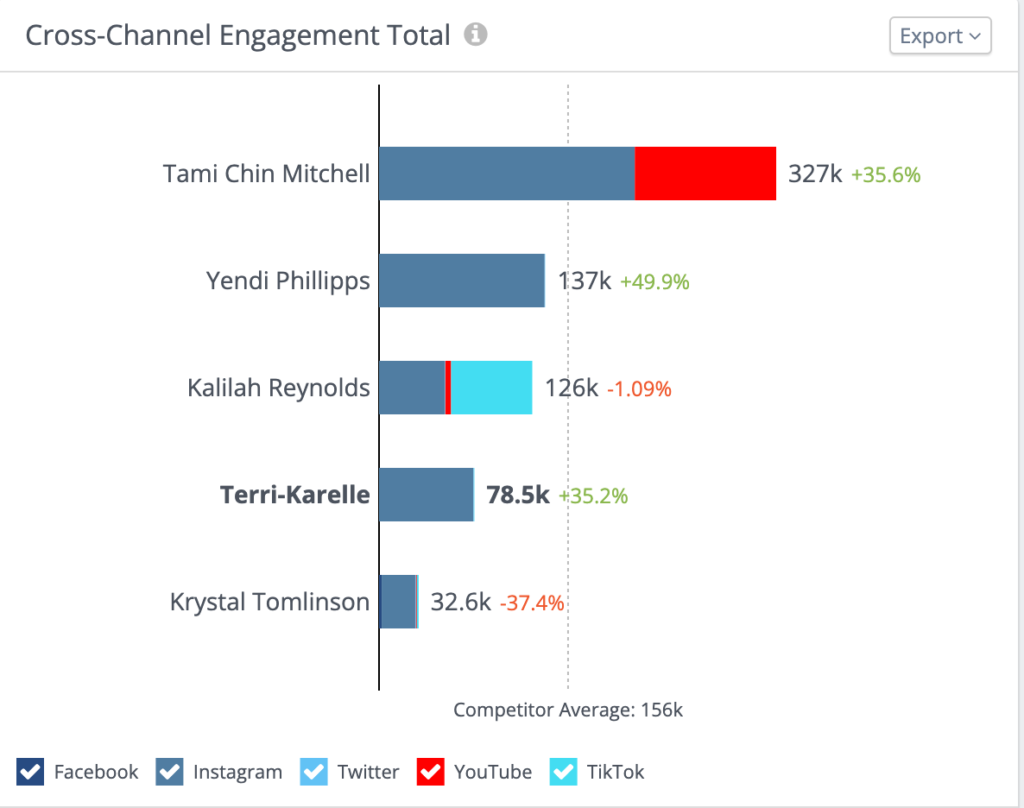
Let’s shift our focus to how Jamaica’s Powerhouse Women are generating excitement with their content! Analyzing their total engagement across all platforms reveals some fascinating insights.
Tami Chin Mitchell leads the pack with a whopping 326,984 total engagements across platforms, showing a significant increase of 35.6%. Notably, her engagement comes primarily from Instagram (210,581) and YouTube (116,403), suggesting her content thrives on these visual and video-centric platforms.
Yendi Phillipps showcases a near-singular focus on Instagram, with a remarkable 136,350 engagements on that platform alone. She hasn’t posted on any other platform outside of Instagram in a while.
Despite a slight decrease (-1.09%) in overall engagement, Kalilah Reynolds maintains a strong connection with her audience, particularly on TikTok (66,842 engagements) and Instagram (54,282 engagements). This highlights the effectiveness of her content on these platforms.
Terri-Karelle Reid’s content has also struck a chord, generating a strong 78,500 engagements. This impressive figure, coupled with a 35.2% increase, showcases her effectiveness in engaging her audience.
Krystal Tomlinson has experienced a notable decrease in cross-channel engagement, with a 37.4% drop bringing her to a total of 32,601 interactions. Despite this downturn, she maintains a strong presence on Instagram, where she garners the majority of her engagement with 27,696 interactions.
Avg Engagement Per Post
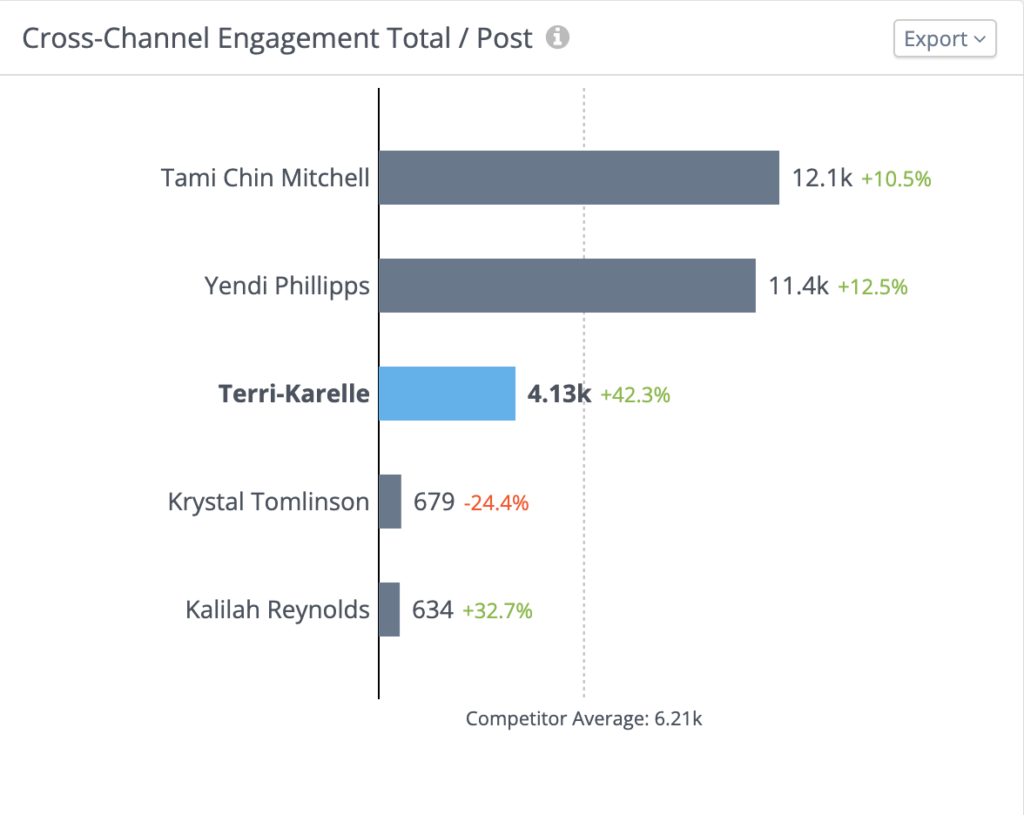
This bar graph showcases the impressive engagement each of our ladies is generating! It reveals an average engagement metric that highlights how well their content connects with each interaction.
Leading the pack is Tami Chin-Mitchell with a phenomenal average of 12.1k engagements per post! This marks a fantastic 10.5% increase, showing an even stronger audience connection. Yendi Phillipps isn’t far behind with a stellar 11.4k average engagement, reflecting a remarkable 12.5% growth. Terri-Karelle stands out with a phenomenal 42.3% surge, reaching an average of 4.13k engagements per post! This highlights a significant leap in the impact of her content.
Kalilah Reynolds’ content is gaining serious traction, with a positive 32.7% increase to 634 engagements per post – a fantastic trend! Krystal Tomlinson has room for some strategic tweaks as her average engagement has shifted to 679 per post.
Compared to the competitor’s average of 6.21k engagements, this data is truly inspiring! Tami Chin Mitchell and Yendi Phillipps are absolute standouts, exceeding the benchmark by a significant margin. Terri-Karelle’s progress is also tremendous, surpassing the average considerably. This information empowers both Krystal Tomlinson and Kalilah Reynolds to refine their strategies for even greater engagement in the future!
Total Cross Channel Applause
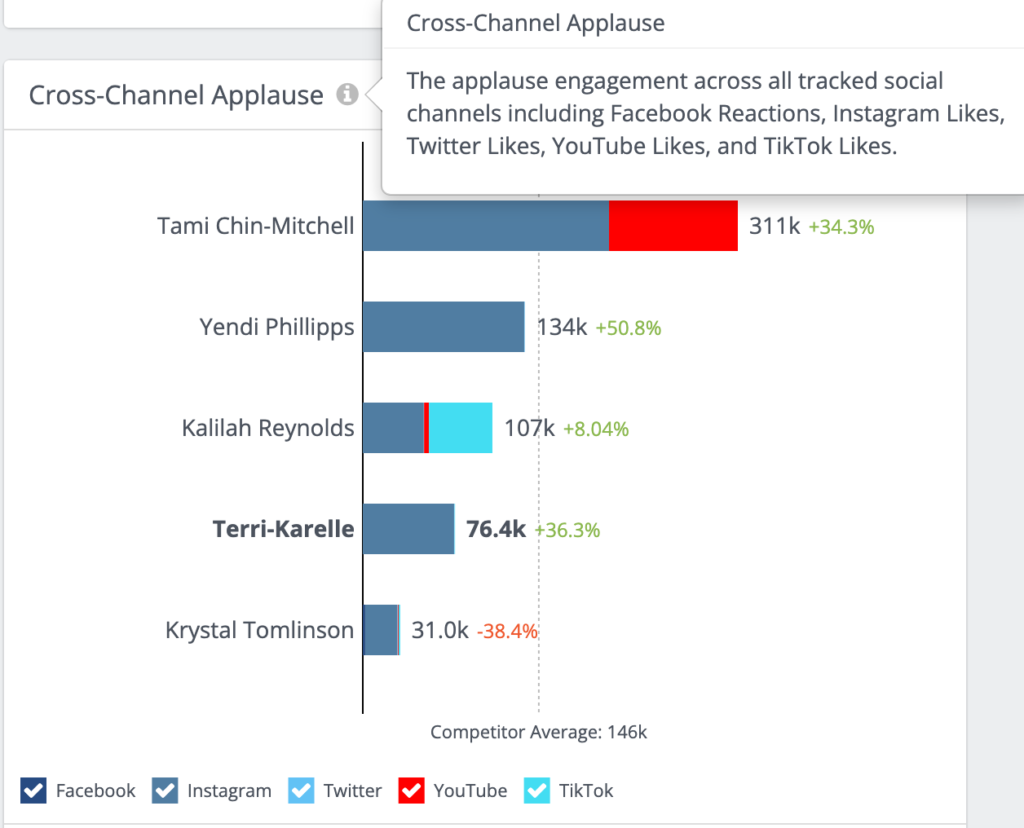
This chart tracks “Cross-Channel Applause,” which showcases the amazing positive reactions our Jamaican ladies are getting across social media! It combines Facebook Reactions, Instagram/Twitter/YouTube/TikTok Likes and gives use a breakdown as to whose content generates the most likes.
Tami Chin-Mitchell is the queen of cheers with a whopping 311k acknowledgments! That’s a fantastic 34.3% increase, showing a deeper connection with her audience. Yendi Phillipps isn’t far behind with a remarkable 134k likes and a record-breaking 50.8% increase – the highest jump in the group! Kalilah Reynolds is also on a roll, with a positive 8.04% rise in approvals, reaching 107k.
Terri-Karelle Reid’s content is a hit too, receiving 76.4k reactions and a fantastic 36.3% increase! Krystal Tomlinson has generated a strong 31k likes in the last month.
This data is especially insightful when compared to the competitor’s average of 146k. It shows the unique ways audiences engage and the power of creating content that truly resonates! This is a great reminder of the ever-changing social media landscape and the importance of adapting to keep your audience excited.
Total cross-channel Conversation
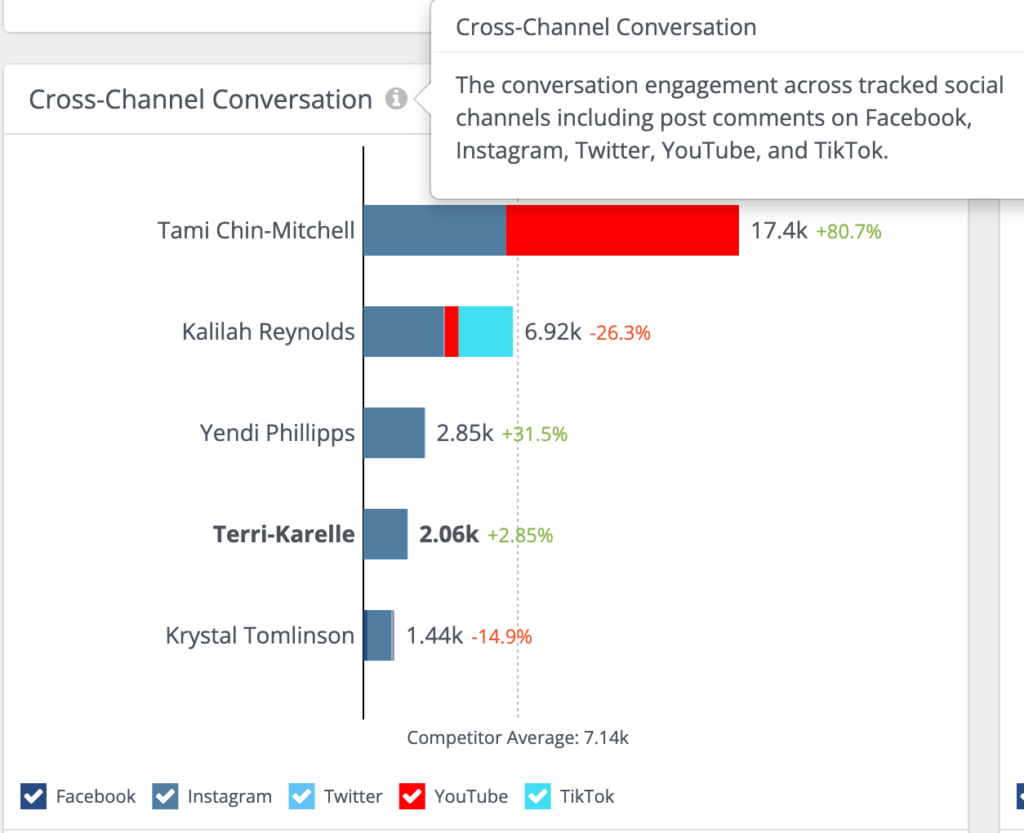
This image shows the impressive levels of two-way conversations our ladies are sparking across social media! It tracks the amount of comments each receives on platforms like Facebook, Instagram, Twitter, YouTube, and TikTok.
Tami Chin-Mitchell is a conversation champion with a whopping 17.4k interactions – an incredible 80.7% increase! This shows a thriving dialogue with her audience. Kalilah Reynolds is also generating significant engagement (a strong 6.92k interactions!), despite a slight decrease of 26.3%.
Yendi Phillipps and Terri-Karelle Reid are both fostering healthy growth in conversation! Yendi Phillipps sees a jump of 31.5% with 2.85k interactions, while Terri-Karelle Reid’s interactions rise by 2.85% to 2.06k.
Even Krystal Tomlinson has a very engaged community as they have dropped 1.44k comments (a 14.9% decrease). Remember, these interactions include comments across platforms, showcasing how actively audiences connect with each influencer’s content.
The competitor average for conversational engagement sits at 7.14k. Tami Chin-Mitchell is leading the pack, significantly surpassing this benchmark!
This information is critical because If you are looking to build more conversations and have your audience comment on your content more, analyse the content of each of our ladies as they know how to create engaging conversations online.
The Top Posts In The Last 30 Days
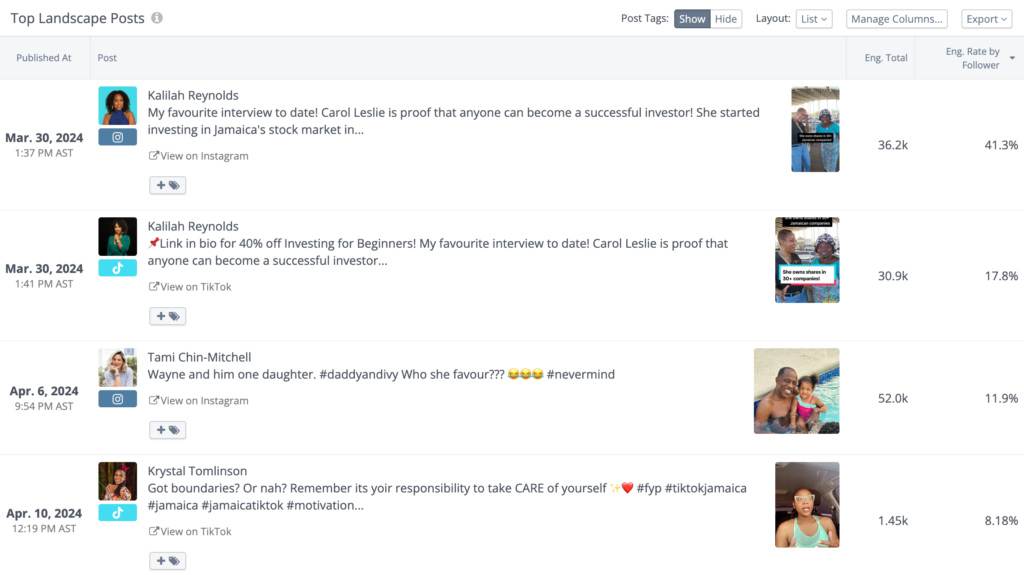
This snapshot showcases the top 4 pieces of content that dropped over the last 30 days.
Kalilah Reynolds takes the crown with two stellar posts! Her interview on investing in the Jamaican stock market with Carol Leslie soared with a whopping 36.2k engagements at an impressive 41.3% rate on Instagram.
Following closely behind is the same post from Kalilah but reposted on TikTok, it generated a fantastic 30.9k engagements at a 17.8% rate.
Tami Chin-Mitchell delivers a heartwarming moment with her daughter and her husband, resonating deeply with her audience. This post garnered a strong 52k engagement rate per follower of 11.9% rate. Krystal Tomlinson also joins the party with a motivational TikTok post on self-care and boundaries. Although achieving a more modest 1.45k engagements at an 8.18% rate, it still sparks important conversations with her audience.
This data offers valuable insights! Go check out each of those posts, make some notes from their top posts and see what you can take away from it to help you improve your content.
Activity And Engagement
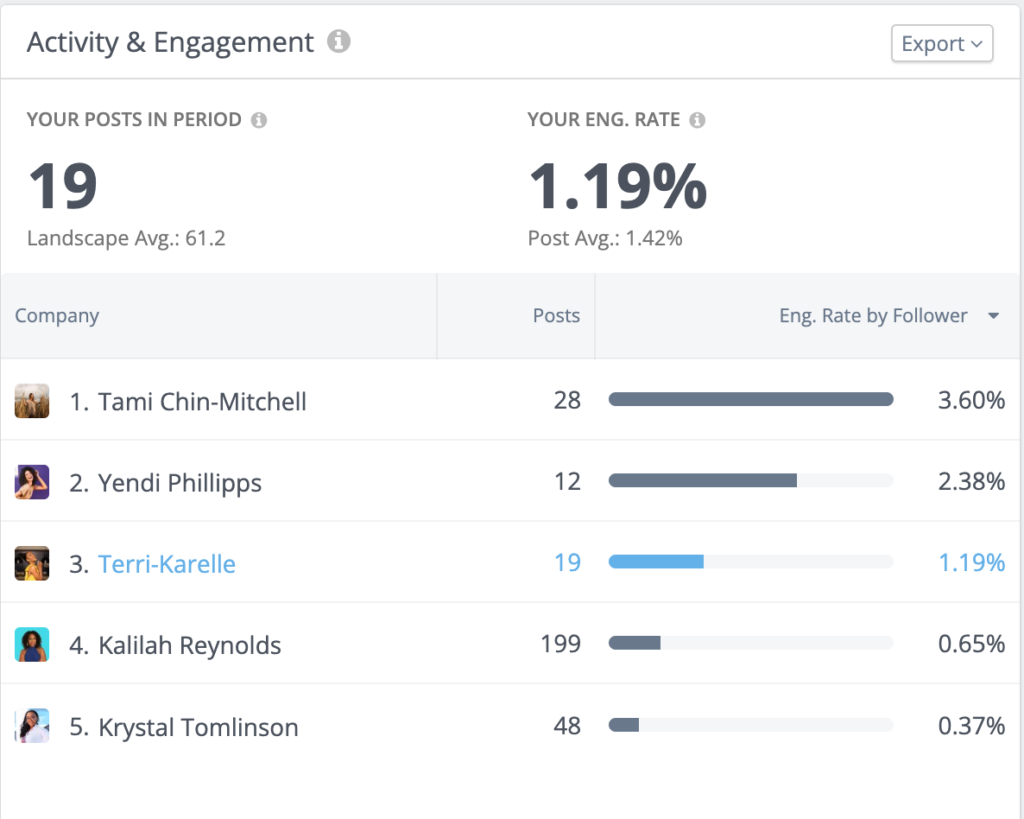
This social media snapshot highlights the fantastic work of our Jamaican influencers over a specific period! Let’s dive into the data:
- Tami Chin-Mitchell is the leader in getting her audience to engage on her content! Her 28 posts achieved the highest rate by follower at an impressive 3.60%.
- Yendi Phillipps follows closely with 12 posts boasting a 2.38% engagement rate.
- Terri-Karelle is holding steady at the overall average of 1.19% engagement with her 19 posts. This consistency is key!
- High fives for Kalilah Reynolds for being our most active creator with a whopping 199 posts! While the engagement rate sits at 0.65%, the sheer volume of content creation is commendable. There’s always the opportunity to refine strategies for even greater engagement in the future.
- Krystal Tomlinson is also creating a lot of content with 48 posts. Engagement is an ongoing journey, and her current rate of 0.37%.
*Engagement rate by follower measures how well your content resonates with your audience per person. It considers both total engagement (likes, comments, etc.) and your follower count. This is a more helpful metric than just total engagement, as it allows you to identify what content truly connects with your unique audience and which personality is connecting with their audience.
Popular Topics That Generated The Most Engagement
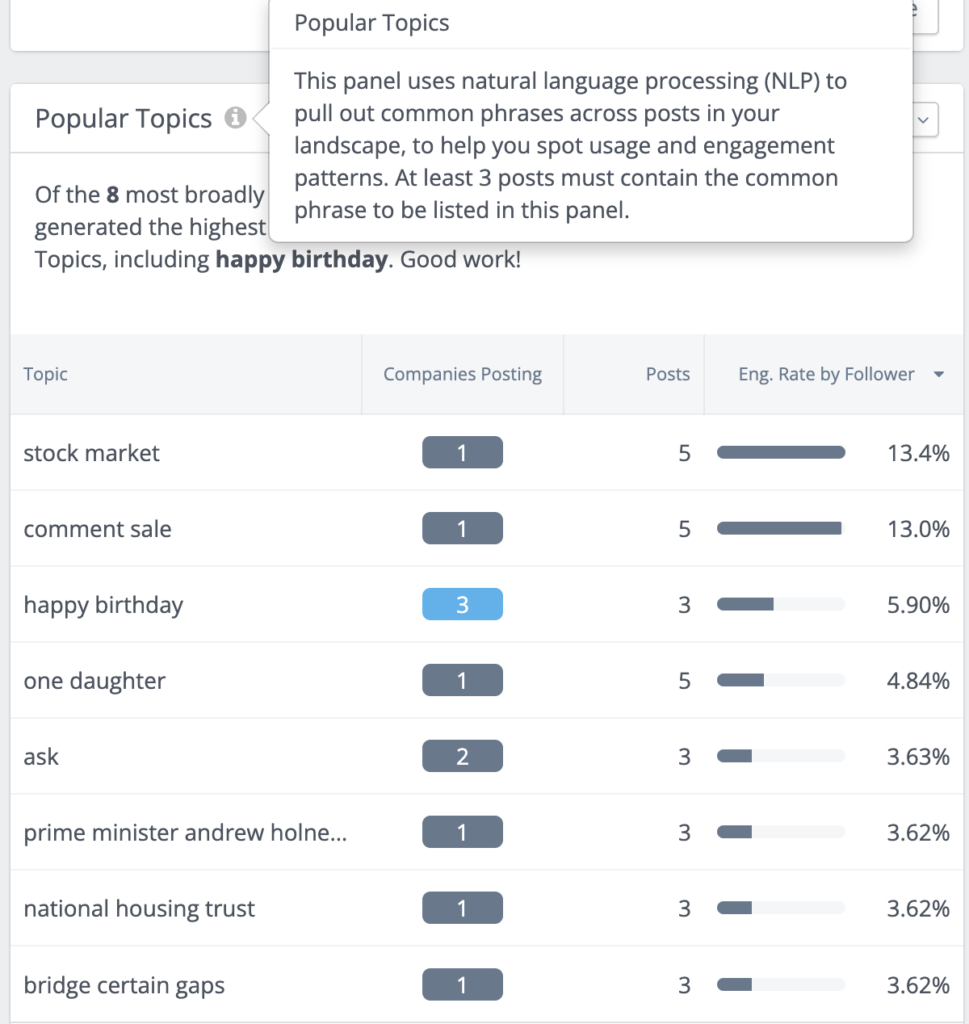
Imagine a super-powered translator for social media! That’s what NLP (Natural Language Processing) is like. It analyzes words to understand what people are talking about. This data panel uses NLP to identify trending topics from a specific group of social media posts.
Here’s what the analysis found:
- Finance is king! “Stock market” and “comment sale” (both at 13% engagement per follower) are top performers.
- Birthday wishes are sweet, but see less engagement (5.9%).
- Other recurring themes include family, questions, politics, and social issues (all around 3.6% engagement per follower).
This shows the audience’s diverse interests, and the 3-post minimum ensures we’re seeing consistent trends, not one-offs.
Engagement By Social Media Platform
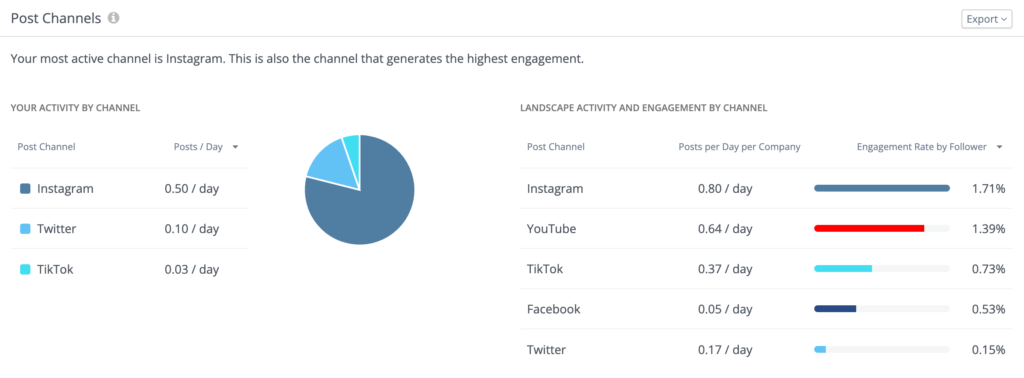
This data dives into which platforms resonate most with this audience, showcasing the social media power of our 5 powerhouse women! On the left-hand side under “Your Activity by Channel”, looks at Dr. Terri-Karelle’s activity and on the right, are the averages of all 5 of our women.
- Instagram is the engagement queen! With a stellar 1.71% engagement rate and a healthy posting rate of 0.80 posts per day, it takes the top spot.
- YouTube joins the party! It boasts a fantastic engagement rate of 1.39% with a posting rate of 0.64 posts per day.
- Don’t underestimate the power of short-form content! Even with a low posting rate of 0.37 posts per day, TikTok still achieves a solid 0.73% engagement rate.
While Facebook has a lower engagement rate of 0.53% and Twitter sits at 0.15% with an average of 0.17 posts per day, every platform offers valuable insights.
This data empowers us to see which channels best connect with the audience. There are clear leaders in Instagram and YouTube, and this information is key to crafting a social media strategy that truly engages!
The Engagement Rate of Various Content Types
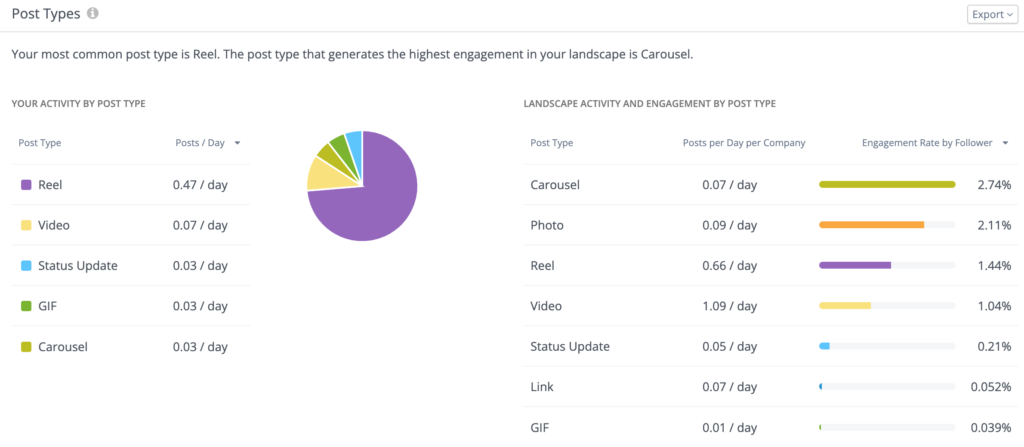
This data dives into what types of social media posts resonate most with this audience! The left-hand side takes a look at Dr. Terri-Karelle’s content types she posts and on the right, is the breakdown of all 5 ladies.
- Carousel posts are the engagement champions! Despite being posted less frequently (0.07 per day), they achieve the highest rate at 2.74%. That’s a win for curated content!
- Photo power! Photos are another crowd-pleaser, grabbing attention with a 2.11% engagement rate and a slightly higher posting frequency (0.09 per day).
- Reels keep it engaging! Posted more often (0.66 per day), Reels still hold a commendable 1.44% engagement rate.
While videos are the most frequent post type (1.09 per day), they see a lower engagement rate of 1.04%. This suggests room for some creative tweaks!
Status updates, links, and GIFs see lower engagement rates (ranging from 0.21% to 0.039%). But hey, every post type offers a way to connect!
Posting Dates, Times and Measuring Engagement For The Group
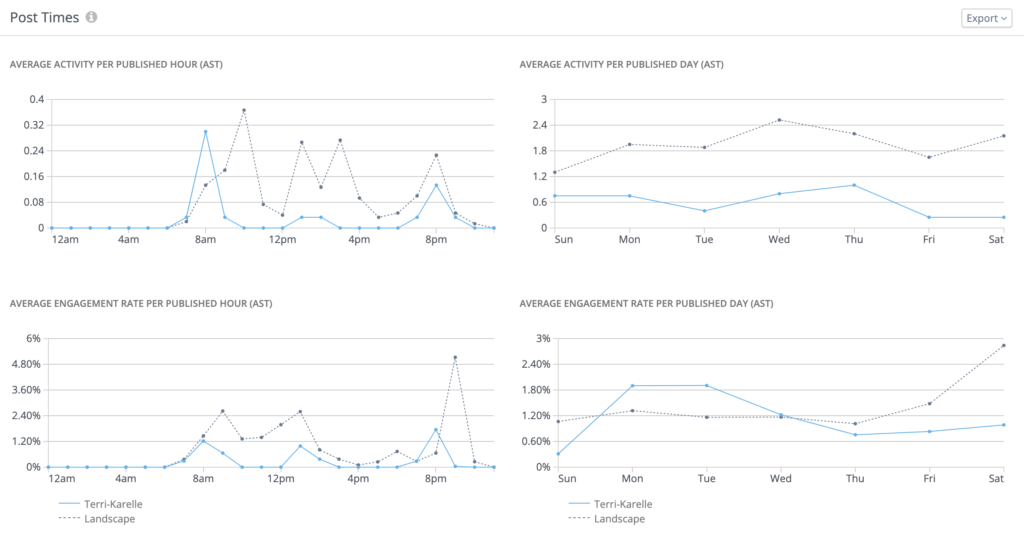
Key Points To Note:
- Terri-Karelle’s social media activity exhibits two primary posting times at 8 am and 8 pm, with Thursday being her most active day of the week.
- In contrast, the group of analyzed women typically posts at 10 am, 1 pm, 3 pm, and again at 8 pm, with their activity peaking on Wednesday, Thursday, and Saturday.
- Terri-Karelle’s content receives the highest engagement rates at 8 am, 1 pm, and 8 pm, whereas the collective group sees their highest engagement at 9 pm, followed by 8 am and 1 pm.
- Analyzing the average engagement rate by day, Terri-Karelle’s content resonates most with her audience on Mondays and Tuesdays, while the broader group experiences the most engagement on Saturdays, with Fridays coming in second.
These patterns are valuable for optimizing post timing to maximize audience engagement.
Let’s Recap
- Most Followers – Yendi Phillipps
- Highest Total Overall Engagement – Tami Chin-Mitchell
- Highest Engagement Per Post – Tami Chin-Mitchell
- Most Likes – Tami Chin-Mitchell
- Most Comments on Content – Tami Chin-Mitchell
- Highest Engagement Rate Per Follower – Tami Chin-Mitchell
- Top Performing Singular Post in The Last 30 Days – Kalilah Reynolds
This case study wasn’t designed to crown a single “community queen.” Instead, it’s about showcasing the diverse approaches women have taken to building thriving online communities. By examining their journeys, you’ve gained valuable insights into effective strategies, content creation, and fostering engagement.
Now, armed with this knowledge, you can revisit these communities with a fresh perspective. Analyze their content themes, engagement tactics, and overall brand voice. See what resonates with your target audience and what might translate well into your own digital marketing strategy. Remember, community building is an ongoing process, so learn, adapt, and implement these strategies to cultivate your own vibrant online space.
If you are a company looking for competitive analysis and need a breakdown like this, reach out here —> Contact Me.